|
Hawaii Ocean Time-series (HOT)
in the School of Ocean and Earth Science and Technology at the University of Hawai'i at Manoa |
|
| » Home » Analytical Results » Particulate Phosphorus | ||||||||||||||||||||||||||||||||||||||||||||
Sampling ProcedureSamples for elemental analyses of Particulate phosphorus (PPO4) were prefiltered through 202-µm Nitex mesh to remove large zooplankton and collected onto combusted, acid washed glass fiber filters (Whatman GF/F, 25 mm diameter). Samples were analyzed using high temperature ashing followed by acid hydrolysis and subsequent determination of the liberated orthophosphate by colorimetry. These procedures are detailed in Karl et al. (1991). The average field variability between duplicate analyses during 2022 are presented in the Table below.
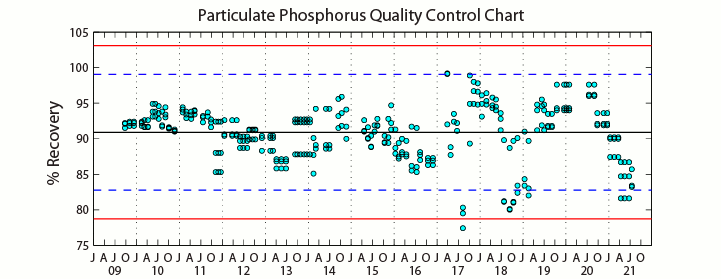
Apple leaves (0.159% P by weight; NIST 1515) were used as a check standard for the recovery of particulate phosphorus (PPO4). A known amount of the std material was placed on a GF/F filter and treated as a sample. The Figure below shows the recovery of PPO4 as reported as the percent of the expected amount of phosphorus in the sample.
Starting November 2011, a modified procedure was used for the analyses of particulate phosphorus. The procedure included vortexing of the sample prior to a longer leaching time (1 hour versus 30 min) of the GFF filter in 0.15 N HCl at room temperature. Both the previous and modified procedures were tested in paired analyses on samples collected over one year (12 cruises). The modified procedure resulted in higher yields by approximately 50% for water column samples (integrated 0-100 m: old method 1.00±0.27 mmol P m-2, versus 1.56±0.14 mmol P m-2) and approximately 30% for P-flux estimated from sediment trap samples (old method: 0.31±0.07 mg P m-2 d-1 versus 0.40±0.09 mg P m-2 d-1). Please see the HOT Data Report 2013 for more detail. ResultsParticulate phosphorus (PPO4) concentrations in the surface ocean over the 34 years of the program are shown in Figure 43 and a contour plot is presented in Figure 44. PPO4 ranges from about 5-25 nmol kg-1 in the upper 100 meters of the water column. An annual cycle is suggested with the greatest particulate phosphorus concentrations in summer/fall and lowest in winter. Substantial interannual variability is also noted. | ||||||||||||||||||||||||||||||||||||||||||||


