|
Hawaii Ocean Time-series (HOT)
in the School of Ocean and Earth Science and Technology at the University of Hawai'i at Manoa |
|
| » Home » Analytical Results » Dissolved Organic Matter | |||||||||||||||||||||||||||||||||||||||||||||||||||||||||||||||||||||||||||||||||||||||||||||||||||||||||||||||||||||||||||||||||||||||||
Dissolved Organic Matter
Sampling ProcedureTotal organic carbon (TOC) was determined by the high temperature catalytic oxidation method using a Shimadzu TOC-V CSH Total Organic Carbon Analyzer. Prior to HOT-125 (March 2001) TOC concentrations had been measured on a commercially available MQ model 1001 TOC analyzer equipped with a LICOR infrared detector. The average precisions during 2022 from triplicate TOC analyses are given in Table 1 below. Table 1: Precision of Total Organic Carbon analyses of replicate samples during 2022
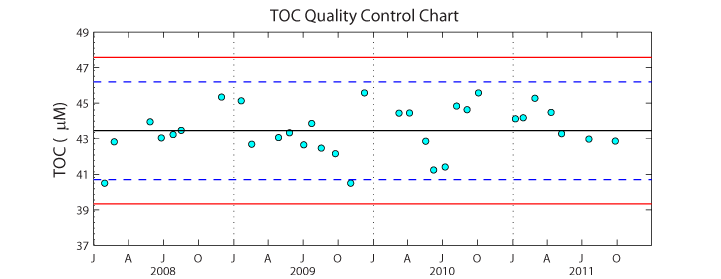
Beginning in 1997, certified TOC reference materials were obtained from J. Sharp (University of Delaware) and D. Hansell (RSMAS, University of Miami) and run each time TOC concentrations were analyzed. UV-oxidation distilled water was used to determine the instrument blank. The figure below shows the time-series of deep seawater reference material (DSRM) obtained from RSMAS used to validate sample measurements. If a value is outside control limits, the run is deemed questionable, and the samples are rerun.
Dissolved organic nitrogen (DON) was calculated as the difference between total dissolved nitrogen (TDN) and [nitrate+nitrite] concentrations. DON by this definition also includes ammonium, however, ammonium concentrations in these waters are below the detection limit of standard nutrient analysis (~ 50 nM). Dissolved organic phosphorus (DOP) was calculated as the difference between total dissolved phosphorus (TDP) and SRP concentrations. DOP, by this definition includes inorganic polyphosphates. TDN and TDP were determined by the UV oxidation method as described in Tupas et al. (1997). The average precisions during 2000 from duplicate analyses are presented in Table 2 below. Table 2: Precision of Dissolved organic nitrogen and phosphorus analyses during 2000
ResultsA contour plot of total organic carbon (TOC) from 0 to 1000 dbar over the 2002-2022 time period is presented in Figure 36 and contour plots of dissolved organic nitrogen (DON) and phosphorus (DOP) from 0 to 1000 dbar over the 1988-2000 time period are presented in Figure 37 and Figure 38. TOC concentrations are typically about 65-75 µmol kg-1 at the surface and decreases to about 45 µmol kg-1 at 800 m. DON is typically 5-6 µmol kg-1 at the surface, decreasing to about 2 µmol kg-1 at 800 meters. DOP is about 0.2-0.3 µmol kg-1 at the surface and decreases to <0.05 µmol kg-1 at 800 m. All three organic nutrients exhibit substatial interannual variability. | |||||||||||||||||||||||||||||||||||||||||||||||||||||||||||||||||||||||||||||||||||||||||||||||||||||||||||||||||||||||||||||||||||||||||


