|
Hawaii Ocean Time-series (HOT)
in the School of Ocean and Earth Science and Technology at the University of Hawai'i at Manoa |
|
| » Home » Analytical Results » Particulate Carbon and Nitrogen | ||||||||||||||||||||||||||||||||||||||||||||||||||||||||||||||||||||||
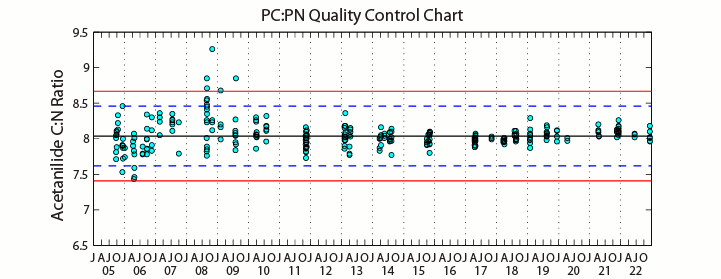
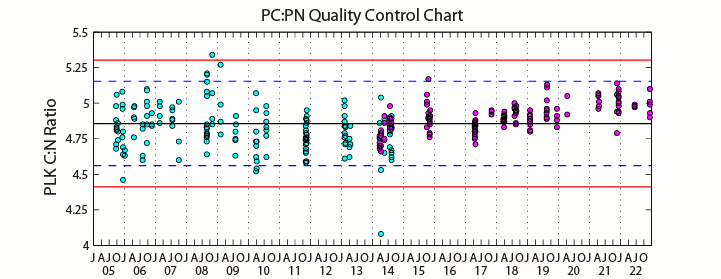
Sampling ProcedureSamples for elemental analyses of Particulate carbon (PC) and nitrogen (PN) were prefiltered through 202 µm Nitex mesh to remove large zooplankton and collected onto combusted glass fiber filters (Whatman GF/F, 25 mm diameter). They were analyzed using an Exeter Analytical CE-440 CHN elemental analyzer. This instrument combines the classical Pregal and Dumas methods for the determination of PC and PN, respectively. The samples are combusted in pure O2 under static conditions and the by-products are measured by a series of high precision thermal conductivity detectors each containing a pair of thermal conductivity cells (P.E.Hemming, Exeter Analytical (UK) Ltd). During the course of the analytical run a maximum of 8 samples are analyzed followed by a blank, check standard (acetanilide) and secondary standard (plankton). The average field variability between duplicate analyses during 2022 are presented in the Table below. Figure A shows the time-series of the acetanilide check standard and Figure B shows the time-series of our in-house plankton secondary standard. Two batches of plankton standards have been used during the course of the time-series. The old batch was used from HOT 166-264 (Sep 2005 - Aug 2014). While the new batch was used starting from HOT-249 (Mar 2014). The old plankton standard is shown in cyan, while the new standard is plotted in magenta. Should the PC/PN ratio of the plankton fall outside the control limits the analytical run is terminated.
ResultsParticulate carbon (PC) and nitrogen (PN) concentrations in the surface ocean over the 34 years of the program are shown in Figure 39 and Figure 41, and contour plots are presented in Figure 40 and Figure 42. PC ranges from about 1-3 µmol kg-1 and PN from 0.1-0.6 µmol kg-1 in the upper 100 meters of the water column. An annual cycle is suggested with the greatest particulate bioelement concentrations in summer/fall and lowest in winter. | ||||||||||||||||||||||||||||||||||||||||||||||||||||||||||||||||||||||


