|
Hawaii Ocean Time-series (HOT)
in the School of Ocean and Earth Science and Technology at the University of Hawai'i at Manoa |
|
| » Home » Analytical Results » Low-level Nutrients | |||||||||||||||||
Low-level Nutrients
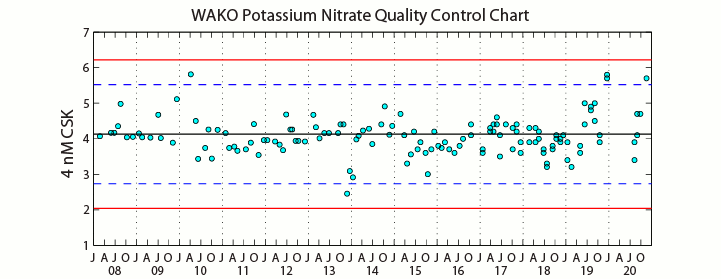
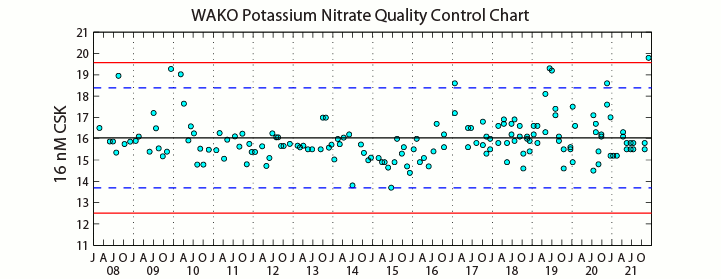
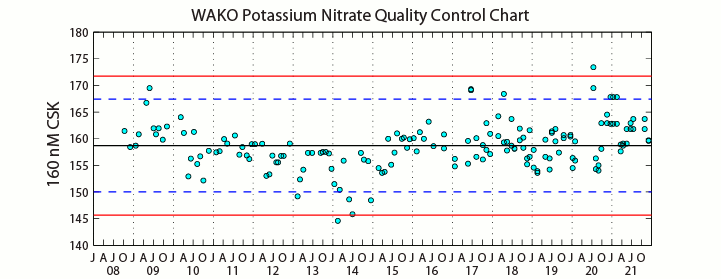
Mixed layer nutrient concentrations at Station ALOHA are at or well below the detection limits of the autoanalyzer methods. Alternative high-sensitivity analytical techniques were used to measure the nanomolar levels of [nitrate+nitrite] and SRP in the upper water column. Low-level [Nitrate + Nitrite]The chemiluminescent method of Cox (1980) as modified for seawater by Garside (1982) was used to determine the [nitrate+nitrite] content of near surface (0-200m interval) water samples. The limit of detection for [nitrate+nitrite] was approximately 2 nM with a precision and accuracy of ± 1 nM (Dore et al. 1996). Time-series of our LLN check standards are shown in Figures A-C. If check standards fall outside their respective control limits the standard curve will be remade until check standards are within their limits.
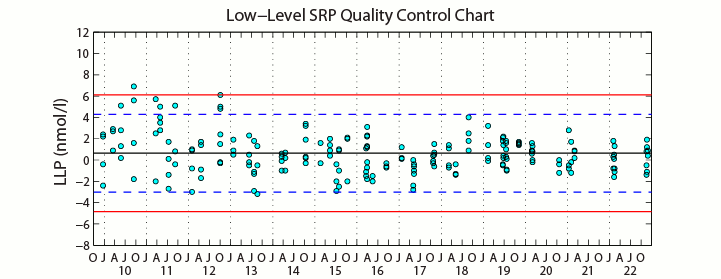
Figure 32 shows the profiles obtained from our low level [nitrate+nitrite] analyses at Station ALOHA during 2021. The upper 100m is generally depleted in [nitrate+nitrite] with values usually not exceeding 35 nmol kg-1. A contour plot of LLN from 0-100 dbar during the 1989-2021 time period is shown in Figure 33. Low-level Soluable Reactive Phosphorus (SRP)Low-level soluable reactive phosphorus (SRP) concentrations in the euphotic zone were determined according to the magnesium induced coprecipitation (MAGIC) method of Karl and Tien (1992). Typical precision estimates for triplicate determinations of SRP are from 1-3% with a detection limit of 2 nM. The MAGIC SRP measurement is also corrected for arsenate interference of the molybdenum blue colorimetric procedure (Johnson 1971), unlike the standard autoanalytical method. Check standards are made by diluting a CSK std (OSIL at 100µM-PO4) to target concentrations of 50 nM and 100 nM PO4 respectively in SSW. The dilutions are made gravimetrically on a Mettler 0-160 g balance by pipetting the OSIL (~ 25 µl and 50 µl), record the weight and adding 50 ml of SSW. These are then treated as regular MAGIC samples. The figure below shows the difference from the expected concentration and that calculated from the absorbance at 880 nm and the standard curve created for each run. Samples to create the standard curve are also made gravimetrically in SSW, but by using an in-house made stock at 100 µM-PO4. Potential sources of error are: 1) balance stability 2) variable volume of SSW that contains some PO4 and 3) spectrophotometer stability.
Figure 34A and Figure 34B presents the low-level SRP data from 2021. At depths shallower than 100m, LLP is typically less than 150 nmol kg-1. A contour plot of LLP from 0-100 dbar during the period 1989-2021 is shown in Figure 35. Several trends are evident, including a general reduction in DIP concentrations from >90 nmol kg-1 in 1989-1990 to <30 nmol kg-1 in 2001. The 0-100m DIP depth integrated inventory was reduced from a high of >10 mmol P m-2 to a low of <2.5 mmol P m-2; more recently, DIP inventories appear to have stabilized and increased from these historic lows. There appear to be aperiodic injections of DIP (for example in early 1995 & 2012 and less dramatic increases in 1998, 2000, 2001, 2003, 2004, 2007, 2009, 2014, 2016, 2018 & 2019). The mechanism(s) controlling these inventory enhancements are not well understood. | |||||||||||||||||


