|
Hawaii Ocean Time-series (HOT)
in the School of Ocean and Earth Science and Technology at the University of Hawai'i at Manoa |
|
| » Home » Analytical Results » Flow Cytometry | ||||||||||||||||||


| ||||||||||||||||||
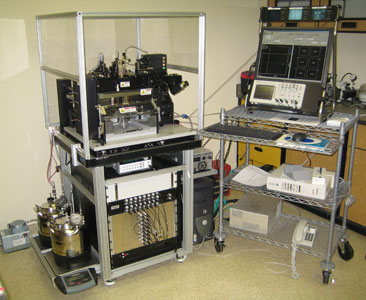
Sampling ProcedureFrom December 1990 through September 2005 (HOT 22-173), analysis of microbial numbers was made using an EPICS 753 flow cytometer (Coulter Electronics Corporation, Hialeah, FL, USA) upgraded with a Cicero Data Acquisition System (Cytomation Inc., Boulder, Colorado). Prior to analysis by flow cytometry, samples were prepared using standard protocols (Monger & Landry 1993; Campbell et al., 1994). Enumeration efficiency was tracked using fluorescent beads. Picoplankton enumeration data collected after HOT-174 were analyzed using a B/D Influx flow cytometer. Three separate chlorophyll containing populations were enumerated by autofluorescence: Prochlorococcus, Synechococcus and the pico-Eukaryotes. Heterotrophic bacteria were enumerated using the DNA stain SYBR Green I and subtracting the previously obtained Prochlorococcus concentration from the DNA positive cells. No adequate marine reference materials exist for flow cytometry. Samples for estimating inter-analysis variations were collected during HOT-281 at Station ALOHA and preserved from both the Deep Chlorophyll Maximum (DCM) and the surface (5 decibars). Several samples from each batch were analyzed each day of analysis. Precision percentages were calculated for both depths for each cell-type. See Figures A-D below. Prochlorococcus in shallow samples are normally difficult to resolve and the precision associated with the counts of these cells represents this methodic limitation. Samples from the DCM and beyond are easily resolved and the precision values on these counts more closely indicate instrument variability.
ResultsDepth profiles of heterotrophic bacterial (actually non-pigmented picoplankton and archaea) and Prochlorococcus abundances for each cruise in 2022 are presented in Figure 60 . A contour plot is shown in Figure 61. At the surface, heterotrophic bacterial numbers (blue) range from 4 to 7 x 10⁵ cells ml-1. In most cases bacterial numbers decrease with depth although there are some profiles where the numbers remain fairly constant with depth throughout the euphotic zone. Prochlorococcus cells (red) are found at concentrations ranging from around 2 to 3 x 10⁵ cells ml-1 at the surface and usually decrease with depth but with a subsurface maximum between 50 and 125 m. Depth profiles of Synechococcus and pigmented eukaryotes are presented in Figure 62 . A contour plot is shown in Figure 63. At the surface, Synechococcus numbers (blue) range from 1 to 3 x 10³ ml-1, and decrease with depth with a subsurface maxima between 50 and 100 m. The abundances of picoeukaryotes (red) typically ranges from 1 to 3 x 10³ ml-1, and similar to Synechococcus, the eukaryote populations generally decline with depth, occasionally exhibiting a subsurface maximum. | ||||||||||||||||||

