|
Hawaii Ocean Time-series (HOT)
in the School of Ocean and Earth Science and Technology at the University of Hawai'i at Manoa |
|
| » Home » Analytical Results » Inverted Echo Sounder | ||||||||||||||||||||||||||||||||||


| ||||||||||||||||||||||||||||||||||
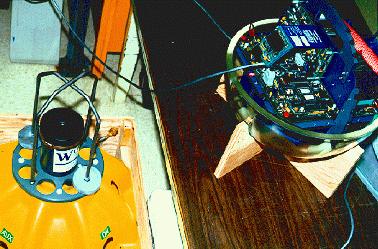
BackgroundThe fundamental benefit of having inverted echo sounders at the deep-water station is that they help put the observed CTD variability into context; an especially important benefit is that they will help determine if monthly sampling is appropriate. There is undoubtedly some mesoscale eddy activity at the deep-water station: Roden (1985) used high-resolution hydrographic data to show alternating bands of strong westward and eastward flow with widths of about 50 km just north of Oahu, and satellite imagery (Jim Price, pers. comm., 1990) shows zonally oriented SST fronts with 200-400 km wavelengths occurring well north of the Hawaiian Islands. We previously had no direct measurements of the eddy-field at the deep-water station, and did not know whether monthly sampling adequately resolves it, or if the eddy energy is aliased into the annual and interannual signals that are the prime focus of HOT. Not much is known about the wave-number spectrum at the deep-water station. Some estimate of the likely scales can be made from the section made north from Oahu by Talley and deSzoeke (1985); they show in peaks in dynamic height at 22.5o, 26o and 29oN, which, if they were due to waves, would imply a north-south wave-length of about 300 km. Roden's (1985) data showed current widths of about 50 km. XBT data from the Hawaii Ocean Experiment show considerable variability with wave-lengths of about 100 km (Jim Price, pers. comm., 1990). While these observations may well be aliased, they suggest that an IES array should be able to resolve wavelengths down to about 100 km. The IES array is an equilateral triangle with 50 km sides. If all IESs return complete data, the orientation is immaterial, since one can recover both components of k from the three measurements of D. The orientation, however, is chosen so that should any one IES fail, we can make an estimate of the zonal component of k. DeploymentIn 1991, a 50-km array of 5 inverted echo sounders (IESs) was deployed as part of the WOCE deep water station. IESs record the round-trip acoustic travel time from the sea floor to the sea surface, which is known to correlate well with dynamic height. The purpose of these observations was to resolve the synoptic variability which may not be resolved by the monthly sampling. The IESs were named according to their location with respect to the center of Station ALOHA (C:center, N:North, E:East, SE:Southeast, SW:Southwest) and recorded data from February 1991 to March 1992 when they were recovered. IESs N, SW, and SE were redeployed in June 1992 and recorded data until their recovery in May 1993. Two IESs recorded data during 1994. The IES C was deployed on 19 May 1993 and recovered on 21 June 1994. The data from this IES were unreadable and only a short section of the timeseries was recovered. Another IES was deployed at Station Kaena (K) on 23 May 1993, and recovered on 18 June 1994. New IESs were deployed at the center of Station ALOHA (C) and at Station Kaena (K) in June 1994 and recovered in October 1995. These two IESs were placed in their respective locations in order to span the Hawaiian Ridge Current. A single IES was deployed at the center of Station ALOHA (C) on October 1995 and recovered on October 1996. Another IES (#126) was deployed at the same site on October 1996, but could not be recovered as planned in July 1997 during cruise HOT-85. The IES was contacted with the hydrophone and it responded confirming the release signal, but it failed to release from its position at the bottom. Operations were conducted during the following cruise (HOT-86) to try to recover the instrument. A 100-m wire with weights attached to it was dragged along the bottom for about 10 hours to try to dislodge the instrument from its presumed position. These activites were unsuccessful and the IES could not be recovered. IES #127 was deployed 4 nm north from the center of Station ALOHA in July 1997 and recovered in July 1998. The same IES was re-deployed at the center of Station ALOHA in August 1998, and was to be recovered on August 12, 1999, but the recovery attempt was unsuccessful as the IES would not rise to the surface after the release command was sent to the instrument. Another unsuccessful attempt to recover the IES was done on November 21 on board of the R/V Ka'Imikai O Kanaloa by using the trawling winch. CTD casts made during 25 monthly cruises to the deep-water station were used to calibrate the IES. The conversion factor from travel time to dynamic height was found to be -54 dyn m/s. The time-series from the IESs show that there are many fluctuations in dynamic height having timescales from weeks to months that are not well resolved with the CTD sampling.
Results
Dynamic height from the inverted echo sounders (IES) after removal of the semi-diurnal, diurnal tides and variability with times-scales less than one day. The plots are staggered at 0.2 dyn-m intervals (the curve labeled "C" corresponds to the y-scale). The dotted line is an average of the N, SW, and SE records between June 1992 and May 1993. This and the 1991-1992 C-record have been calibrated from CTD casts at Station ALOHA made during 25 cruises. The C and Kaena records for the following years were also calibrated against the CTD data from HOT cruises. The horizontal axis above the plots shows the HOT cruise numbers. The locations of the deployments were changed in May 1993 (one IES was deployed at Station Kaena, K) in order to span the Hawaiian Ridge Current. | ||||||||||||||||||||||||||||||||||