|
Hawaii Ocean Time-series (HOT)
in the School of Ocean and Earth Science and Technology at the University of Hawai'i at Manoa |
|
| » Home » Analytical Results » pH | |||||||||||||||||||||||||||||||||||||||
pH
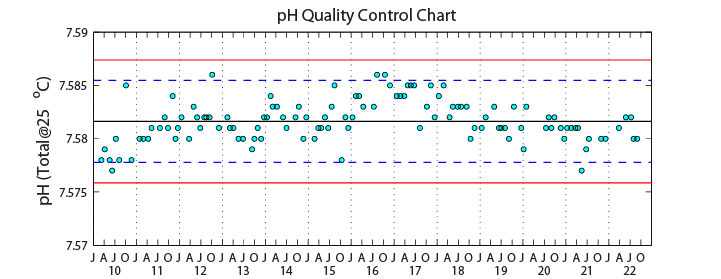
Sampling ProcedureFeb 17, 2009 - All HOT pH data presently available through HOT-DOGS were collected using the spectrophotometric method of Clayton and Byrne (1993) and are reported at a constant temperature of 25ºC. The +0.0047 unit correction suggested by DelValls and Dickson (1998) has NOT been applied to any HOT data. The 1992-1993 HOT pH data were originally reported on the Seawater Scale, while later data have all been reported on the Total Scale. For the sake of consistency, the 1992-1993 pH data have as of today been converted to the Total Scale according to Lewis and Wallace (1998). The Total Scale values are approximately 0.01 pH units higher than the Seawater Scale values they replace. The cruises affected are HOT 36-47 and HOT 49-50. Prior to 1992, on HOT 23-32, pH measurements were made using a pH electrode calibrated with NBS buffers and were reported on the NBS Scale. Potentiometric measurements of pH are inherently less precise than spectrophotometric measurements. Moreover, the relationship between the NBS Scale and the Total Scale is not exact and depends on characteristics of the electrode employed. Given these difficulties, we have not attempted to correct the pre-1992 data to the Total Scale. They are available in the raw data files via FTP and remain as reported on the NBS Scale, but have been assigned a questionable quality flag and thus are not accessible through HOT-DOGS. The pooled annual CV of the pH analysis during 2022 was 0.018% (Table below). It was calculated by averaging the mean CV of N-duplicate samples on each cruise. The time-series of measured values at 4500 decibars at Station ALOHA are shown in the Figure below.
ResultsThe structure of pH (Figure 19) in the upper water column closely resembles that of dissolved inorganic carbon (Figure 17). There appears to be a slight increase in pH during the winter months and gradually decreases after that. This is directly related to the drawdown of inorganic carbon in the water column during the spring and summer periods. ReferencesClayton, T.D., and R.H. Byrne. 1993. Spectrophotometric seawater pH measurements: total hydrogen ion concentration scale calibration of m-cresol purple and at-sea results. Deep-Sea Res. I 40: 2115-2129. DelValls, T.A., and A.G. Dickson. 1998. The pH of buffers based on 2-amino-2-hydroxymethyl-1,3-propanediol (tris) in synthetic seawater. Deep-Sea Res. I 45: 1541-1554. Lewis, E., and D.W.R. Wallace. 1998. Program Developed for CO2 System Calculations. ORNL/CDIAC-105. Carbon Dioxide Information Analysis Center, ak Ridge National Laboratory, U.S. Department of Energy, Oak Ridge, Tennessee. | |||||||||||||||||||||||||||||||||||||||


