|
HOT-DOGS
Hawaii Ocean Time-series Data Organization & Graphical System |
|
| » Home » HOT-DOGS » Tutorial » Example 9 | |||


| |||
|
Example 9 - Time-series
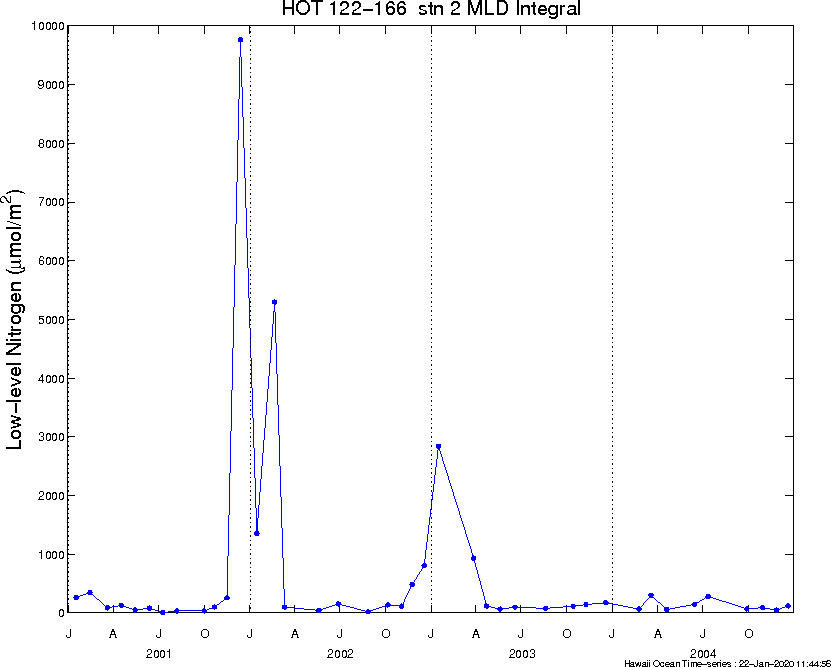
2001-2004, time-series integral of (Low-level) Nitrogen data between the surface and the bottom of the mixed-layer created using Horizontal Profiles/Time-series/Bottle module.
set Year(s) to '2001-2004'
set Operator to 'Low-level Nitrogen' set Station # to '2' set Function Grouping to 'Mixed-layer Depth' set Function to 'Integral' set Grouping to '(none)' The mixed layer is defined as a .125 kg/m3 potential density (σθ) difference from the surface (Levitus [1982]). 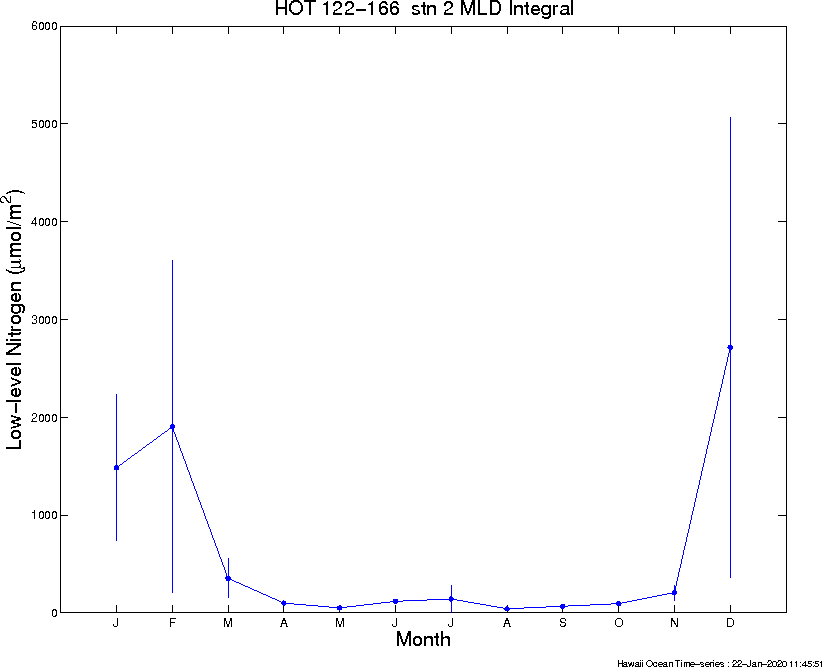
Same as above, except group according to month.
set Year(s) to '2001-2004'
set Operator to 'Low-level Nitrogen' set Station # to '2' set Function Grouping to 'Mixed-layer Depth' set Function to 'Integral' set Grouping to 'Month' month, n, mean, StdDev, StdErr #, #, umol/m2, umol/m2, umol/m2 1, 3, 1482.677, 1292.699, 746.340 2, 3, 1901.595, 2941.400, 1698.218 3, 4, 352.735, 397.731, 198.866 4, 3, 99.079, 37.966, 21.920 5, 3, 49.928, 11.249, 6.495 6, 4, 117.136, 35.790, 17.895 7, 2, 141.348, 195.151, 137.992 8, 3, 41.080, 30.948, 17.868 9, 1, 66.804, 0.000, 0.000 10, 5, 92.989, 38.583, 17.255 11, 5, 206.978, 171.696, 76.785 12, 4, 2713.858, 4710.210, 2355.105 Same as above, except output as text instead of as a PNG file.
set Year(s) to '2001-2004'
set Operator to 'Low-level Nitrogen' set Station # to '2' set Function Grouping to 'Mixed-layer Depth' set Function to 'Integral' set Grouping to 'Month' set Output type to 'text' month, crn, julian, lln #, #, day, umol/m2 1, 122, 4491, 260.413 1, 134, 4855, 1351.769 1, 144, 5221, 2835.849 2, 123, 4519, 346.804 2, 135, 4891, 5294.101 2, 156, 5625, 63.879 3, 124, 4554, 84.715 3, 136, 4911, 97.922 3, 146, 5292, 931.270 3, 157, 5649, 297.033 4, 125, 4582, 127.450 4, 147, 5318, 113.839 4, 158, 5681, 55.949 5, 126, 4610, 47.997 5, 137, 4980, 39.769 5, 148, 5345, 62.018 6, 127, 4639, 78.850 6, 138, 5019, 150.981 6, 149, 5375, 94.643 6, 160, 5737, 144.071 7, 128, 4666, 3.356 7, 161, 5764, 279.340 8, 129, 4694, 31.077 8, 139, 5079, 16.370 8, 151, 5437, 75.792 9, 163, 5842, 66.804 10, 130, 4749, 31.692 10, 131, 4770, 99.066 10, 140, 5119, 135.048 10, 152, 5492, 111.916 10, 164, 5874, 87.223 11, 132, 4795, 254.809 11, 141, 5147, 112.469 11, 142, 5168, 482.793 11, 153, 5518, 139.169 11, 165, 5902, 45.651 12, 133, 4822, 9763.801 12, 143, 5192, 801.943 12, 154, 5558, 171.721 12, 166, 5925, 117.968 Same as above, except show how each cruise's integral is grouped (by month).
set Year(s) to '2001-2004'
set Operator to 'Low-level Nitrogen' set Station # to '2' set Function Grouping to 'Mixed-layer Depth' set Function to 'Integral' set Grouping to 'Month' set Output type to 'text' select 'Show Grouping' |
|||