|
HOT-DOGS
Hawaii Ocean Time-series Data Organization & Graphical System |
|
| » Home » HOT-DOGS » Tutorial » Example 4 | |||


| |||
|
Example 4 - Display
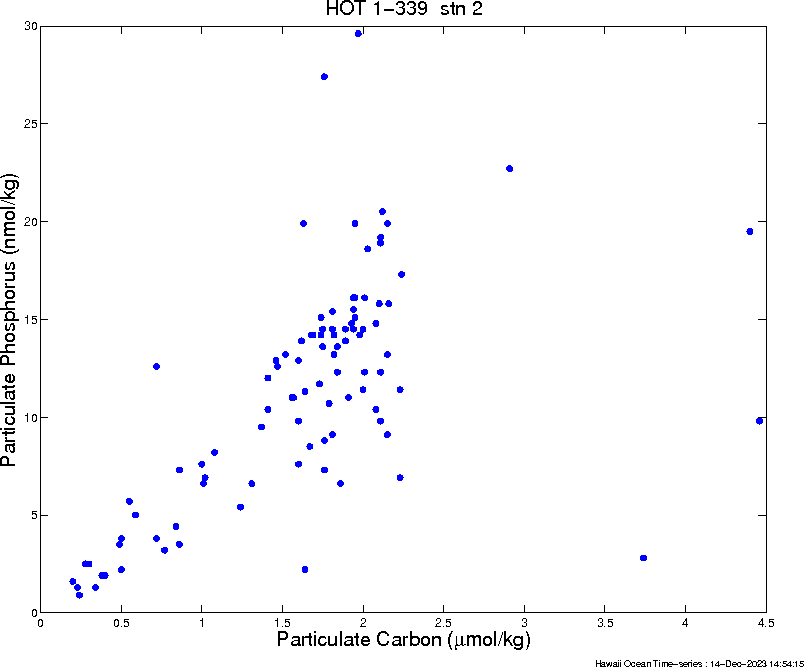
Plot of Particulate Carbon vs. Particulate Phosphorus created using Vertical Profiles/Display/Bottle module.
set X-axis to 'Particulate Carbon'
set Y-axis to 'Particulate Phosphorus' set Station # to '2' (ALOHA) 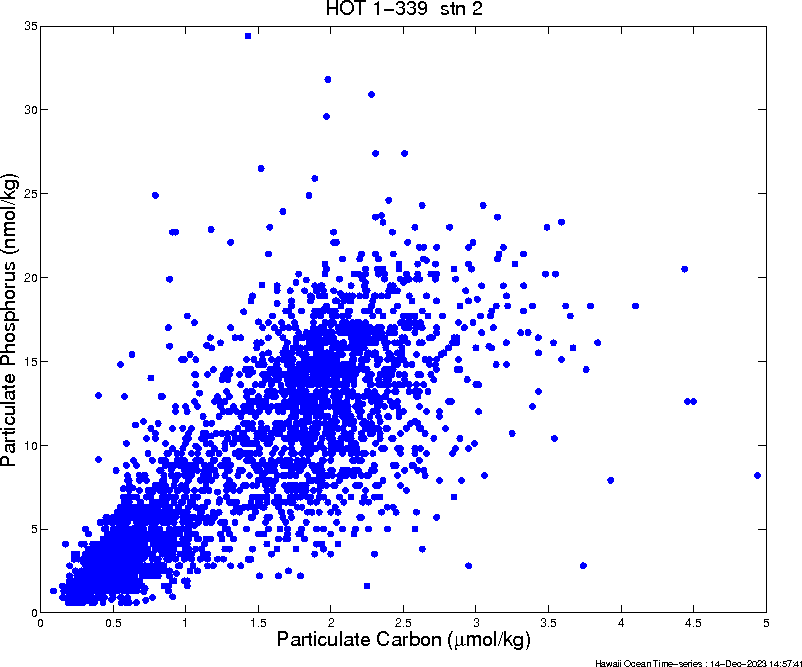
Same as above, except use depth averaged data.
set X-axis to 'Particulate Carbon'
set Y-axis to 'Particulate Phosphorus' set Station # to '2' (ALOHA) select 'Use Standard Depths' In general, data can only be plotted if taken out of the same niskin bottle. Selecting 'Use Standard Depths' uses depth averaged data to match data taken on separate casts. The default depths are at:
5, 25, 45, 75, 100, 125, 150, 175, 200, 250, 350, 500, 750 & 1020m
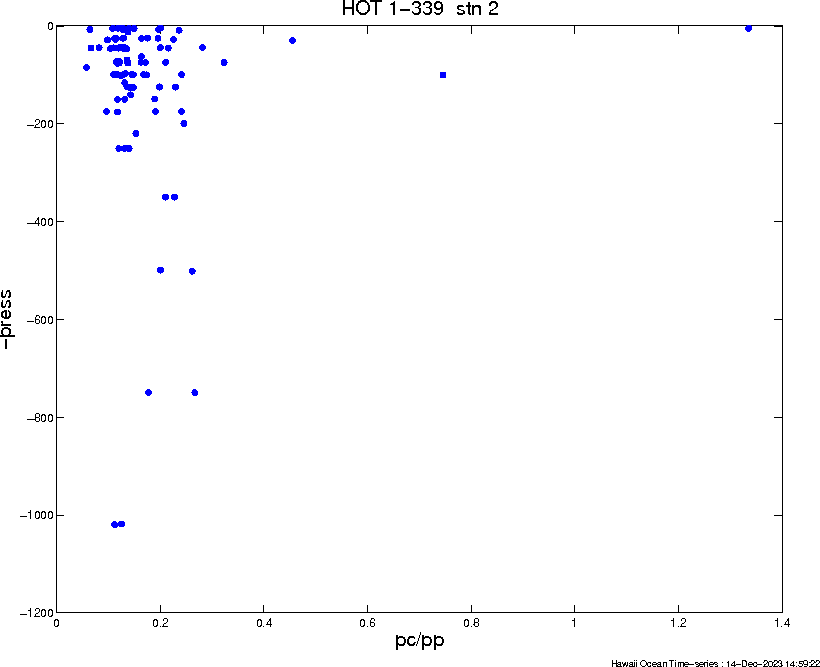
Plot of Particulate Carbon : Particulate Phosphorus created using Vertical Profiles/Display/User Defined module.
set X-axis to 'pc/pp'
set Y-axis to '-press' set Station # to '2' (ALOHA) The User Defined modules are used to show ratios, although any mathematical formula using the basic arithmetic operators (/,*,+,-) could be used. Refer to the variable listing for available variable names. 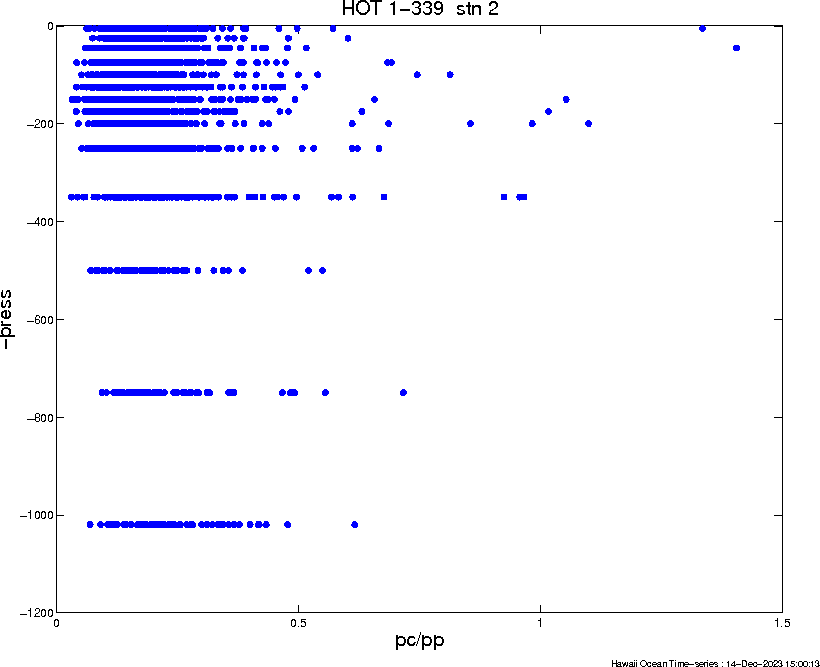
Same as above, except use depth averaged data.
set X-axis to 'pc/pp'
set Y-axis to '-press' set Station # to '2' (ALOHA) select 'Use Standard Depths' This example also shows how the Figure Title, X-axis label & Y-axis label can be changed by selecting Modify from the Menubar. |
|||