|
HOT-DOGS
Hawaii Ocean Time-series Data Organization & Graphical System |
|
| » Home » HOT-DOGS » Tutorial » Example 5 | |||


| |||
|
Example 5 - Display
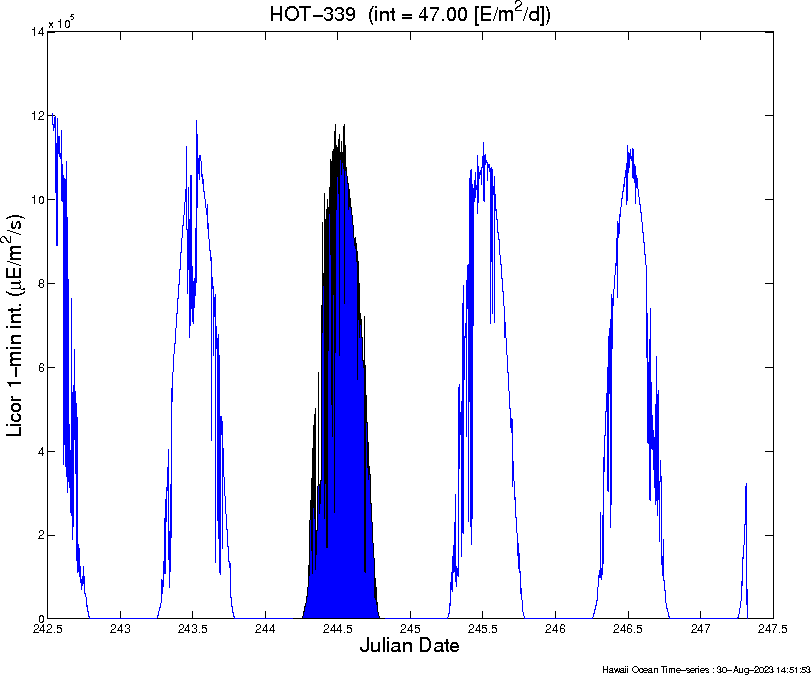
Summary plot of HOT-339 (Sep 2022) Solar Irradiance created using Vertical Profiles/Display/Solar Irradiance module.
set Cruise # to '339'
select Highlight time of PP incubation In this example, the time that our Primary Production Array was deployed is highlighted in blue and the total light integral is listed at the top of the figure in parenthesis. 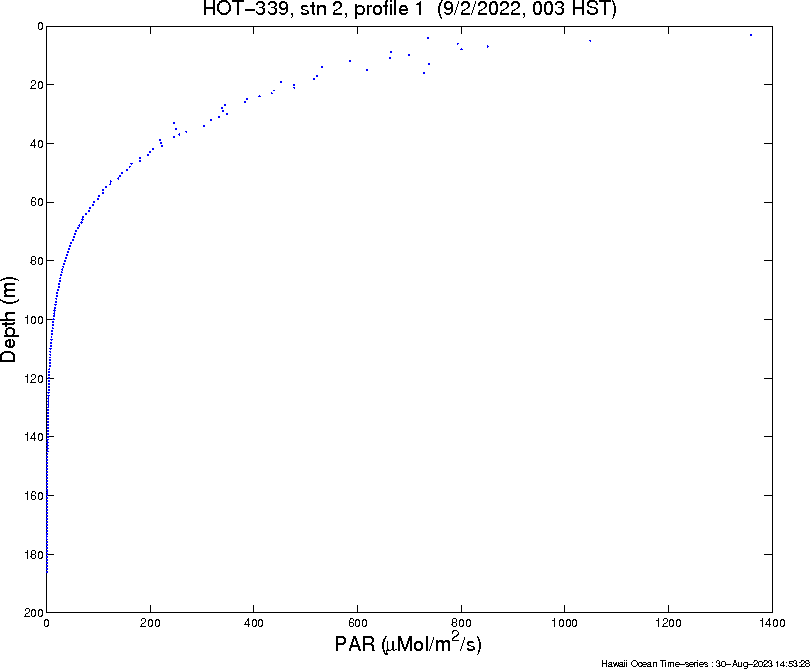
Plot of HOT-339 (Sep 2022) downcast PAR (Photosynthetically Available Radiation) created using Vertical Profiles/Display/Hyperspectral (Ir)radiance module.
set Cruise # to '339'
set X-axis to 'PAR' set Y-axis to 'Depth' set Station # to '2' set Profile # to '1' Usually, 6 profiles are taken during the cruise. The first 2 are at Station Kahe, and the remaining 4 are at Station ALOHA. 
Plot of HOT-169 (May 2005) Photosynthetic efficiency (FV/FM) created using Vertical Profiles/Display/Fast Repetition Rate Fluorometry module.
set Cruise # to '169'
set X-axis to 'FV/FM' |
|||