|
HOT-DOGS
Hawaii Ocean Time-series Data Organization & Graphical System |
|
| » Home » HOT-DOGS » Tutorial » Example 7 | |||


| |||
|
Example 7 - Standard Intervals
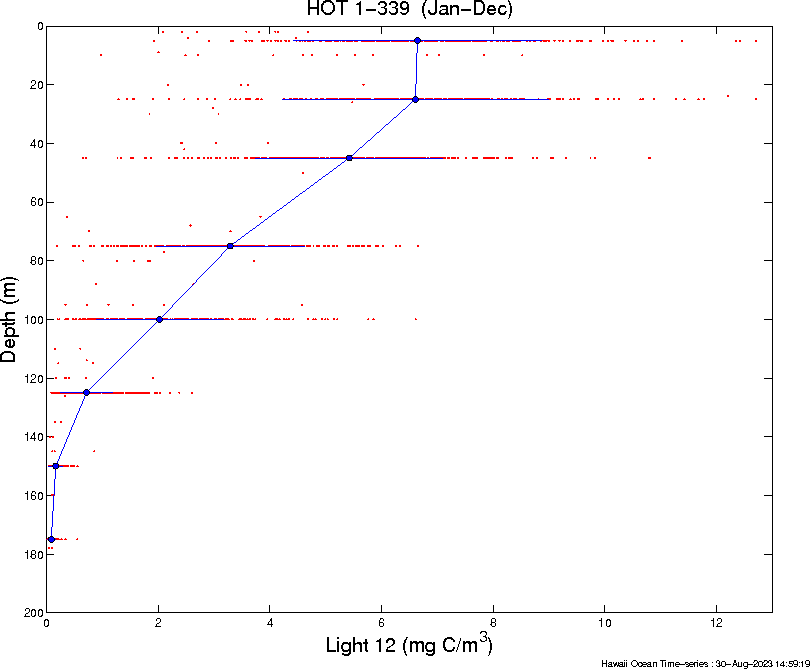
Summary plot of Primary Production data created using Vertical Profiles/Standard Intervals/Primary Production module.
set X-axis to 'Light 12'
set Axis to '[0 13 -200 0]' select 'Include Standard Deviations' select 'Include Data Points' 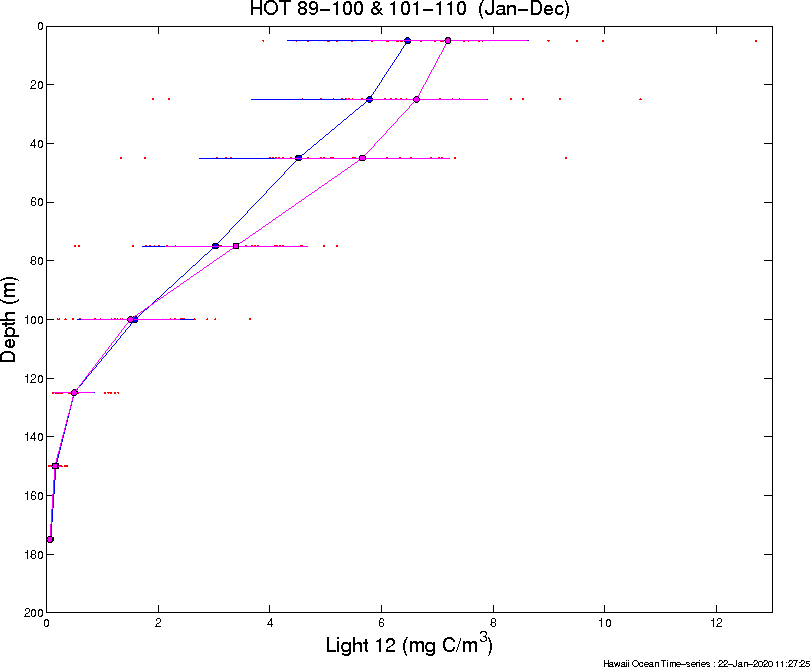
Compare 1998 & 1999 data.
set Primary Year to '1998'
set Secondary Year to '1999' set X-axis to 'Light 12' set Axis to '[0 13 -200 0]' select 'Include Standard Deviations' select 'Include Data Points' In this example and the next, the "primary" data set is displayed in blue, while the "secondary" is display using magenta. 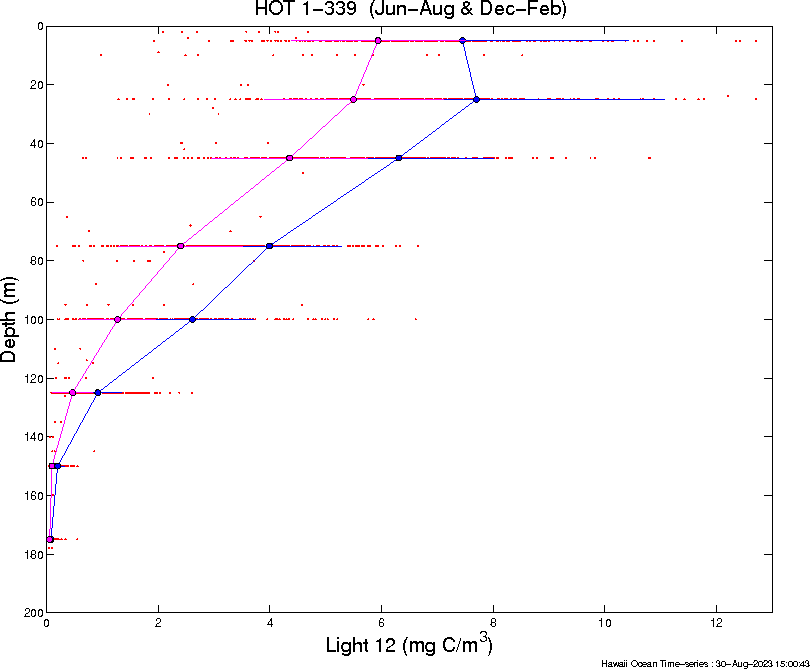
Compare summer & winter data.
set Primary Month to '6-8'
set Secondary Month to '12-2' set X-axis to 'Light 12' set Axis to '[0 13 -200 0]' select 'Include Standard Deviations' select 'Include Data Points' Hawaii Ocean Time-series : 30-Aug-2023 15:01:38 https://hahana.soest.hawaii.edu/hot/hot-dogs/ppseason.html primary data set depth, n, minVal, maxVal, mean, stdDev, stdErr m, #, mg C/m3, mg C/m3, mg C/m3, mg C/m3, mg C/m3 5.0, 80, 1.923, 25.230, 7.451, 2.979, 0.333 25.0, 83, 1.290, 27.220, 7.702, 3.370, 0.370 45.0, 83, 1.270, 10.817, 6.312, 1.699, 0.186 75.0, 79, 0.467, 6.660, 3.990, 1.292, 0.145 100.0, 80, 0.917, 6.613, 2.618, 1.094, 0.122 125.0, 80, 0.237, 2.033, 0.917, 0.427, 0.048 150.0, 35, 0.047, 0.495, 0.198, 0.120, 0.020 175.0, 29, 0.027, 0.175, 0.078, 0.039, 0.007 secondary data set depth, n, minVal, maxVal, mean, stdDev, stdErr m, #, mg C/m3, mg C/m3, mg C/m3, mg C/m3, mg C/m3 5.0, 81, 2.005, 12.360, 5.940, 1.561, 0.173 25.0, 76, 1.843, 10.880, 5.500, 1.605, 0.184 45.0, 75, 0.710, 8.313, 4.356, 1.397, 0.161 75.0, 77, 0.467, 5.647, 2.402, 1.113, 0.127 100.0, 73, 0.200, 3.257, 1.275, 0.682, 0.080 125.0, 75, 0.093, 2.380, 0.466, 0.353, 0.041 150.0, 25, 0.035, 0.247, 0.097, 0.047, 0.009 175.0, 22, 0.015, 0.107, 0.054, 0.028, 0.006 Same as above, except output as text instead of as a PNG file.
set Primary Month to '6-8'
set Secondary Month to '12-2' set X-axis to 'Light 12' select 'Include Standard Deviations' set Output type to 'text' |
|||