|
HOT-DOGS
Hawaii Ocean Time-series Data Organization & Graphical System |
|
| » Home » HOT-DOGS » Tutorial » Example 10 | |||

| |||
|
Example 10 - Time-series
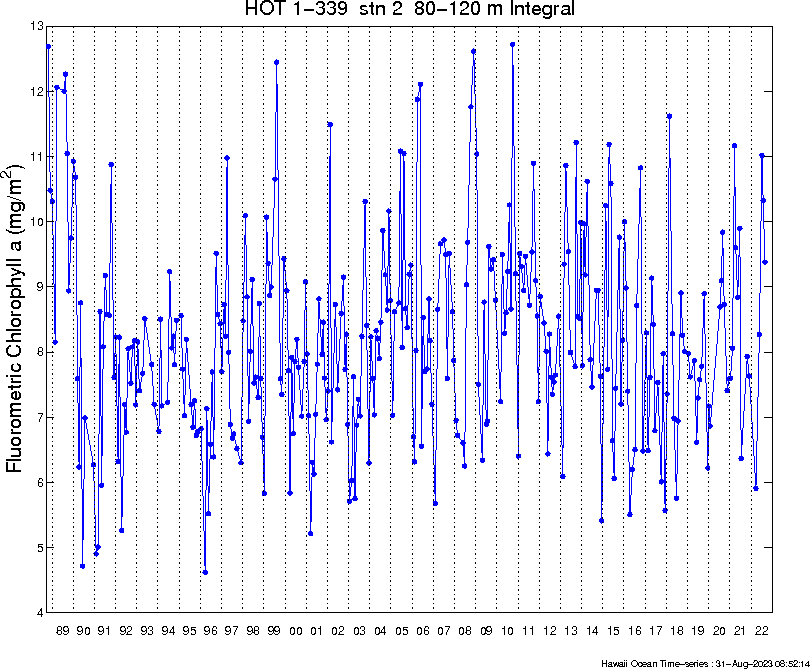
80-120m time-series integral of Fluorometric Chlorophyll a data created using Horizontal Profiles/Time-series/Bottle module.
set Operator to 'Fluorometric Chlorophyll a'
set Station # to '2' set Function Grouping to 'Depth' set value/range to '80-120' set Function to 'Integral' set Grouping to '(none)' 
Calculate the 80-120m mean & standard deviation.
set Operator to 'Fluorometric Chlorophyll a'
set Station # to '2' set Function Grouping to 'Depth' set value/range to '80-120' set Function to 'Mean/StDev' set Grouping to '(none)' 
Calculate the 100m horizon.
set Operator to 'Fluorometric Chlorophyll a'
set Station # to '2' set Function Grouping to 'Depth' set value/range to '100' set Function to 'Horizon' set Grouping to '(none)' The figures above show the 3 functions the time-series modules calculates. Integrals & means must have a range of values, while horizons must have a single value. |
|||