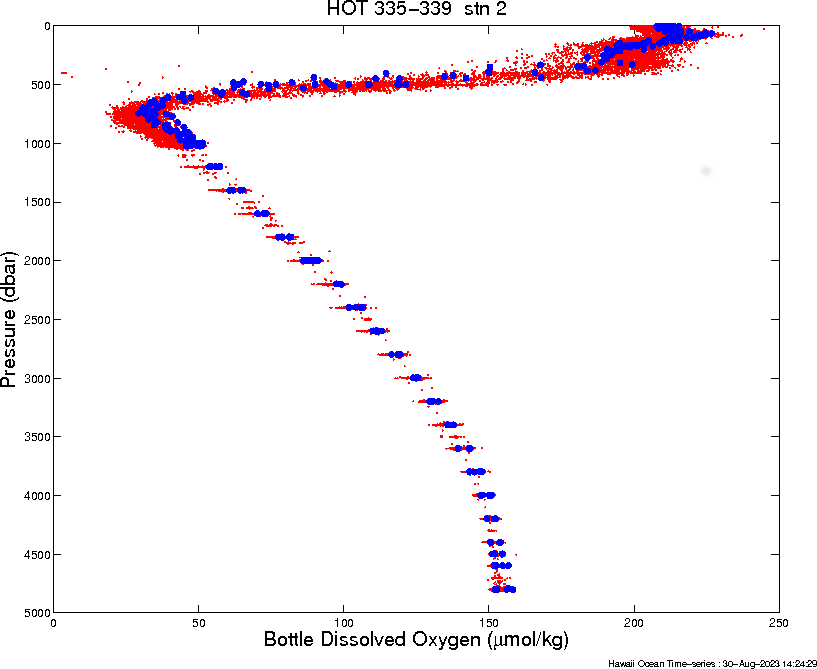
set X-axis to 'Bottle Dissolved Oxygen'
set Y-axis to 'Pressure'
set Year to '2022'
set Station # to '2' (ALOHA)
select 'Include Historical Data'
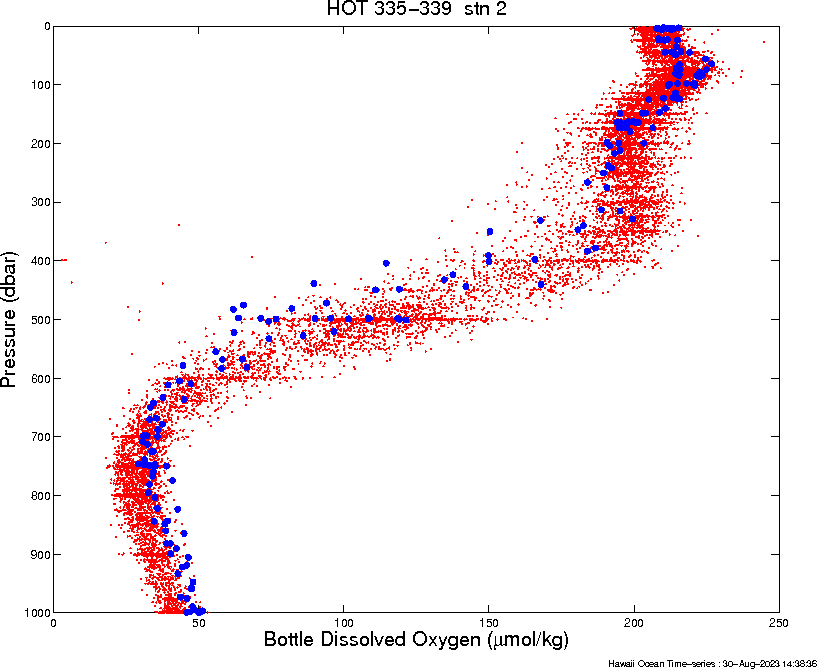
Same as above, except in the upper 1000 meters.
set X-axis to 'Bottle Dissolved Oxygen'
set Y-axis to 'Pressure'
set Year to '2022'
set Station # to '2' (ALOHA) set Axis to '[0 250 -1000 0]'
select 'Include Historical Data'