HOT-DOGS
Hawaii Ocean Time-series Data Organization & Graphical System |
|
» Home » HOT-DOGS » Tutorial » Example 3 | |||
Example 3 - Display
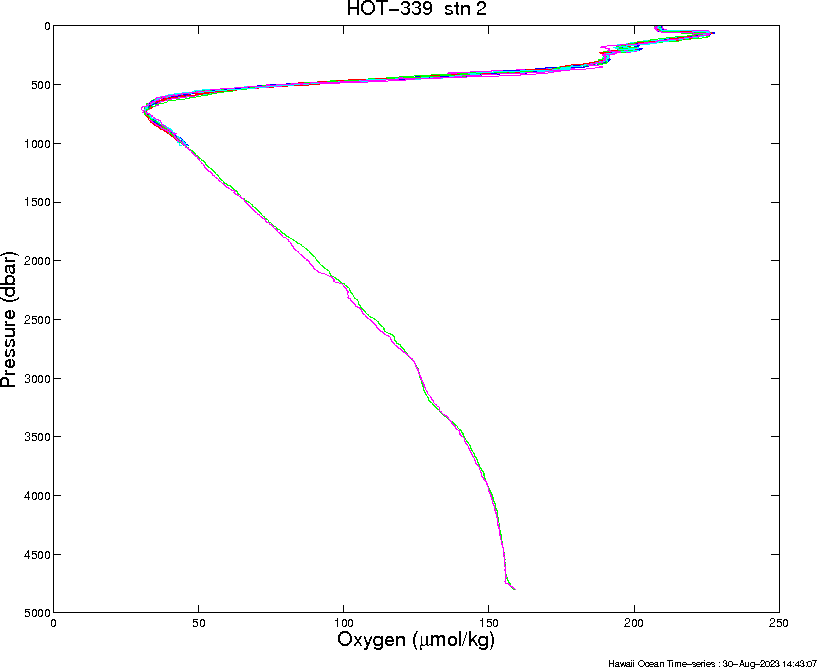
Plot of HOT-339 (Sep 2022) CTD Dissolved Oxygen data created using Vertical Profiles/Display/CTD module.
set X-axis to 'Oxygen'
set Y-axis to 'Pressure' set Cruise to '339' set Station # to '2' (ALOHA) 
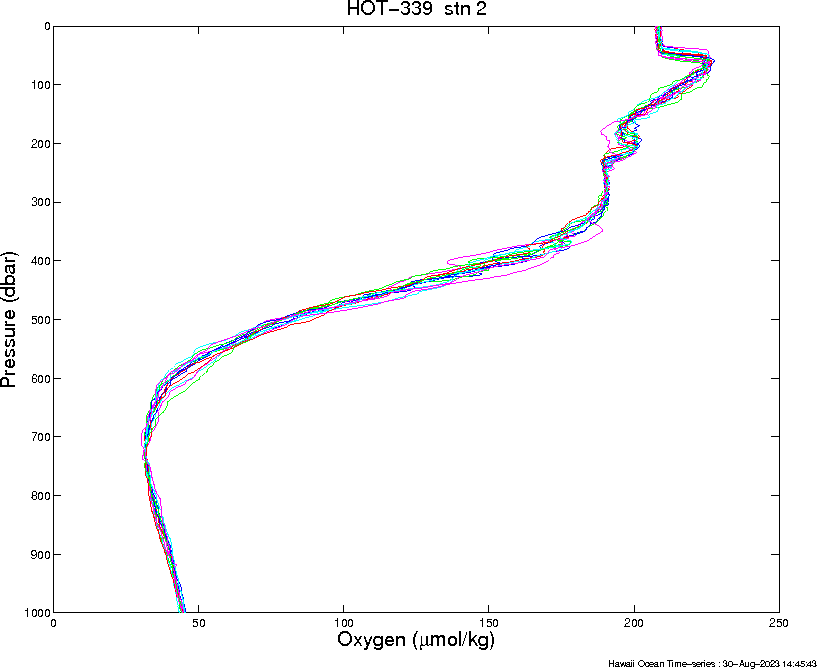
Same as above, except in the upper 1000 meters.
set X-axis to 'Oxygen'
set Y-axis to 'Pressure' set Cruise to '339' set Station # to '2' (ALOHA) set Axis to '[0 250 -1000 0]' 
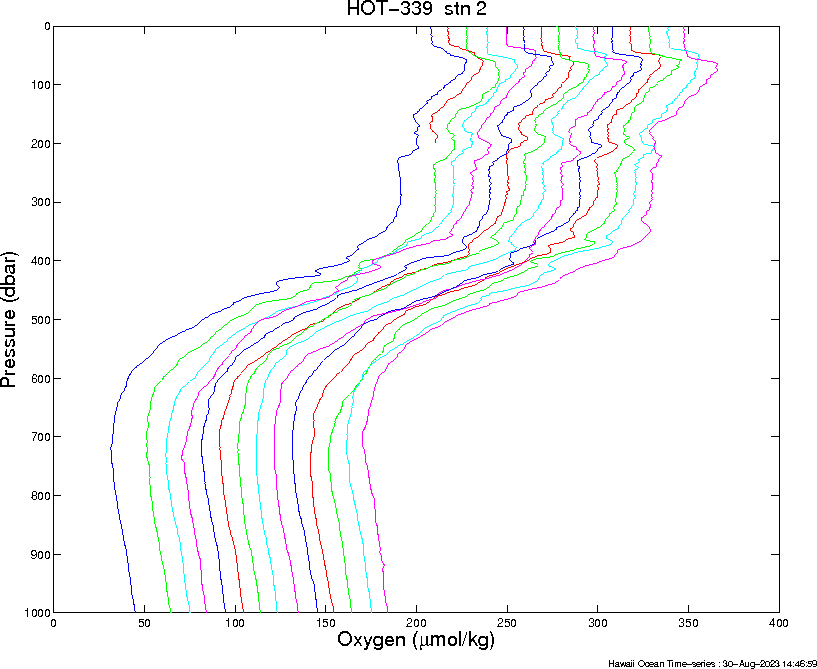
Same as above, except stagger the data to make it easier to view.
set X-axis to 'Oxygen'
set Y-axis to 'Pressure' set Cruise to '339' set Station # to '2' (ALOHA) set Axis to '[0 400 -1000 0]' select 'Stagger Plot' |