HOT-DOGS
Hawaii Ocean Time-series Data Organization & Graphical System |
|
» Home » HOT-DOGS » Tutorial » Example 6 | |||
Example 6 - Standard Intervals
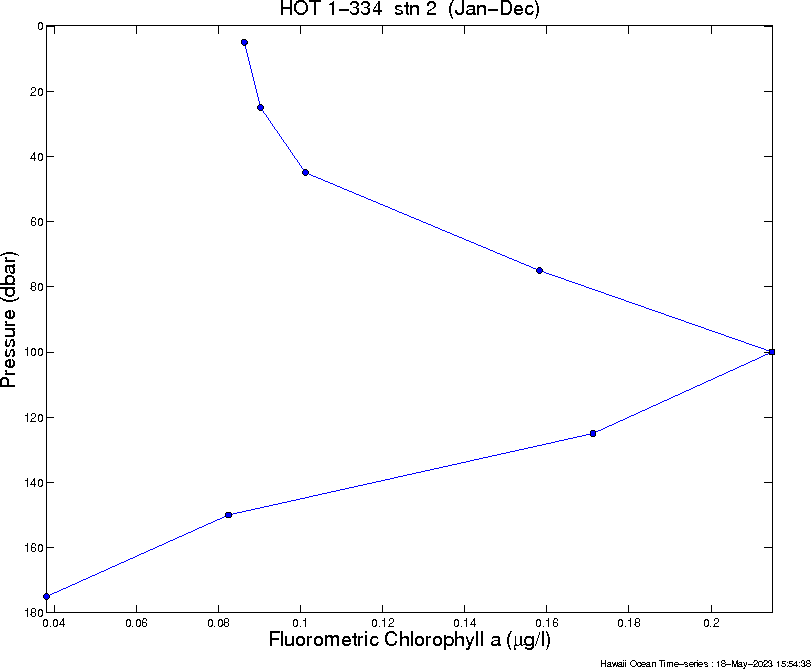
Summary plot of Fluorometric Chlorophyll a created using Vertical Profiles/Standard Intervals/HPLC Pigments module.
set X-axis to 'Fluorometric Chlorophyll a'
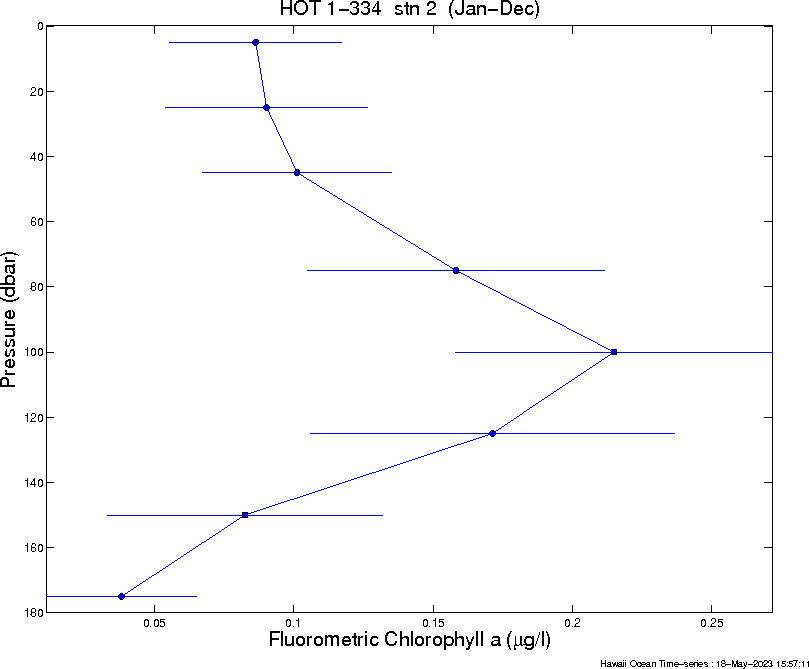
Same as above, except include standard deviations.
set X-axis to 'Fluorometric Chlorophyll a'
select 'Include Standard Deviations' 
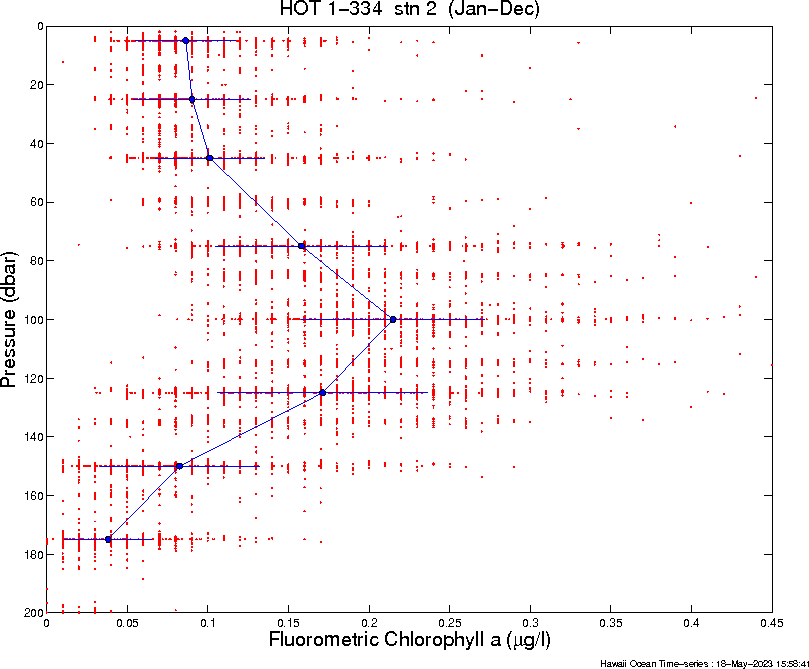
Same as above, except include data points used for the calculations as well.
set X-axis to 'Fluorometric Chlorophyll a'
set Axis to '[0 .45 -200 0]' select 'Include Standard Deviations' select 'Include Data Points' |