|
Hawaii Ocean Time-series (HOT)
in the School of Ocean and Earth Science and Technology at the University of Hawai'i at Manoa |
|
| » Home » Analytical Results » DIC and Total Alkalinity | ||||||||||||||||||||||||||||||||||||||||||||||||||||||||||||||||||||||||||||||||||||||||||||||||||


| ||||||||||||||||||||||||||||||||||||||||||||||||||||||||||||||||||||||||||||||||||||||||||||||||||
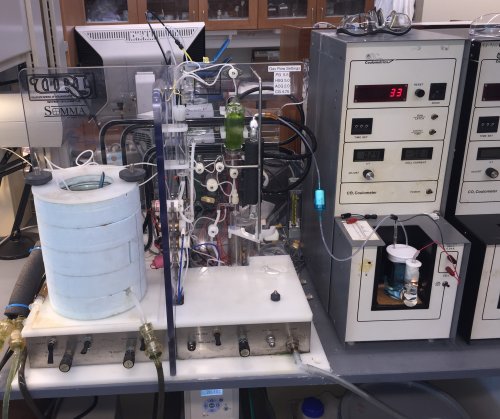
Sampling ProcedureSamples for dissolved inorganic carbon (DIC) were measured using a Single Operator Multi-parameter Metabolic Analyzer (SOMMA) which was manufactured at the University of Rhode Island and standardized at the Brookhaven National Laboratory. The pooled annual CV of the DIC analysis during 2021 was 0.03% (Table below). It was calculated by averaging the mean CV of N-duplicate samples on each cruise. Total alkalinity (TAlk) was determined using the modified Gran titration method as described in Tupas et al. (1997). The pooled annual CV of the total alkalinity analysis during 2021 was 0.12% (Table below).
The accuracy of DIC and total alkalinity measurements was established with certified reference material (CRMs) obtained from Andrew Dickson at Scripps Institution of Oceanography. The time-series of measured differences from the CRM are shown in the figures below.
ResultsTime-series of mixed-layer total alkalinity and DIC from 1988-2021 are presented in Figure 16. A contour plot of dissolved inorganic carbon is shown in Figure 17 and a contour plot of total alkalinity is shown in Figure 18. Mixed layer total alkalinity normalized to 35 ppt salinity averages approximately 2305 µeq/kg. No obvious seasonal or interannual pattern is evident. This observation is consistent with the results of Weiss et al. (1982) who conclude that total alkalinity normalized to salinity remains constant in both the North and South Pacific subtropical gyres. In contrast to total alkalinity, the concentration of DIC varies seasonally & interannually. DIC in the mixed layer is highest in March and April and lowest in September and October. This oscillation results from winter mixing of DIC rich waters from below and biological drawdown of CO2 in the shallow summer mixed layers (Ishii, M. et al., 2001). Using this data, Dore et al. (2003) found a significant decrease in the strength of the CO2 sink between 1989 and 2001 due to changes in regional precipitation and evaporation patterns brought on by climate variability. Overall, mixed layer DIC continues to rise due to air-sea exchange with the growing atmospheric CO2 reservoir (Dore et al., 2014). | ||||||||||||||||||||||||||||||||||||||||||||||||||||||||||||||||||||||||||||||||||||||||||||||||||

