|
Hawaii Ocean Time-series (HOT)
in the School of Ocean and Earth Science and Technology at the University of Hawai'i at Manoa |
|
| » Home » Analytical Results » Hydrography | |||||||||||||||||||||||||||||||||||


| |||||||||||||||||||||||||||||||||||
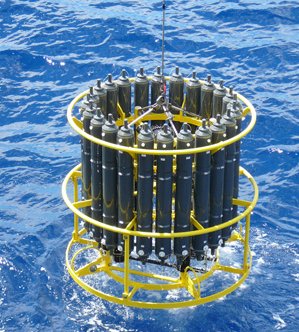
The majority of our sampling effort, approximately 60-72 h per standard HOT cruise, is spent at Station ALOHA. High vertical resolution environmental data are collected with a Sea-Bird CTD having external temperature (T), conductivity (C), dissolved oxygen (DO) and fluorescence (F) sensors and an internal pressure (P) sensor. A Sea-Bird 24-place carousel and an aluminum rosette that is capable of supporting 24 12-L PVC bottles are used to obtain water samples from desired depths. The CTD and rosette are deployed on a 3-conductor cable allowing for real-time display of data and for tripping the bottles at specific depths of interest. The CTD system takes 24 samples s-1 and the raw data are stored both on the computer and, for redundancy, on VHS-format video tapes (prior to HOT-322) and as an audio signal on a laptop PC (HOT-322 - present). In February 2006, before cruise 178, we replaced our 24 aging 12-L PVC rosette bottles with new 12-L bottles fabricated at the University of Hawaii Engineering Support Facility, using plans and specifications from John Bullister (PMEL). CTD ProfilingContinuous temperature, salinity, oxygen, and fluorescence measurements are made with a Sea-Bird SBE-9/11Plus CTD package with dual temperature, salinity, oxygen sensors, and a fluorometer described in Tupas et al. (1995). In 2021 the CTD underwater unit #91361 was used during cruises HOT-326 through HOT-328. During a CTD deployment on HOT-328, the winch wire accidentally parted, and the CTD underwater unit #91361 fell from about 2 m on the ship’s deck, damaging the rosette, the CTD, its sensors, and various sampling bottles. The CTD and its sensors were sent to SeaBird for evaluation and repair. Our backup CTD #1377, acquired in 2021, was used for the rest of the HOT-328 cruise and during HOT-329 through HOT-331. However, during HOT-331, the winch wire accidentally parted again during a CTD cast, and the CTD package fell to the bottom at Station ALOHA. Kilo Moana’s CTD #65431 was used for the rest of the cruise and during HOT-332 through HOT-334. Our old CTD #850 was used during the WHOTS-17 cruise. CTD casts to depths between 2400 and 2500 m were conducted at Station Kaena (Station 6) during HOT-329, -332, and -333. Regular CTD casts have been conducted since August 2004 in the vicinity of the WHOTS mooring to calibrate its sensors. During cruises, HOT-326, -329, -330, -331, and -332, five yo-yo cycles to a depth of 200 m were carried out near the WHOTS-16 mooring (Station 52: 40° 0.10'N, 157° 56.961' W) located at the southeastern edge of the ALOHA circle. However, only three yo-yo cycles were conducted during HOT-327, while during HOT-328, two cycles to a depth of 200 m and one cycle to 350 m were completed. On August 26, 2021, the WHOTS-17 mooring (Station 50: 46° 0.002'N, 157° 53.958' W) was deployed near the northeastern edge of the ALOHA circle. During HOT-333, five yo-yo cycles to a depth of 200 m were carried out near the new mooring position. Only one cycle to 1000 m was performed during HOT-334. Data Acquisition and ProcessingCTD data were acquired at a rate of 24 samples per second. Digital data were stored on a laptop personal computer and for redundancy, the CTD signal was recorded using a USB sound card and Audacity® software on a separate laptop. Backups of CTD data were made onto USB storage cards and compact disks. The raw CTD data were quality controlled and screened for spikes described in Winn et al. (1993). Data alignment, averaging, correction and reporting were done as described in Tupas et al. (1993). Salinity spike rejection parameters were modified for some cruises in 2021 because of rough sea conditions. Spikes occur when the CTD samples the disturbed water of its wake; therefore, samples from the downcast are rejected when the CTD is moving upward or when its acceleration exceeds 0.5 m s-2 in magnitude. Some cruises were conducted under relatively rough conditions. The CTD acceleration cutoff value had to be increased to between 0.55 and 1 ms-2 for some casts to relax the data rejection criteria and avoid eliminating excessive points. The World Meterological Organization (WMO) Sea State codes are as follows:
The data were additionally screened by comparing the temperature and conductivity sensor pairs. These differences permitted identification of problems in the sensors. Only the data from one set of T-C sensors and one oxygen sensor, whichever was deemed most reliable, are reported here. Temperature is reported in the ITS-90 scale. Salinity and all derived units were calculated using the UNESCO (1981) routines; salinity is reported in the practical salinity scale (PSS-78). Oxygen is reported in µmol kg-1. Chloropigment (Fluorescence) is reported in µg/l. | |||||||||||||||||||||||||||||||||||