|
Hawaii Ocean Time-series (HOT)
in the School of Ocean and Earth Science and Technology at the University of Hawai'i at Manoa |
|
| » Home » Analytical Results » Particulate Biogenic Silica | ||||||||||||||||||||||||||||||||||||||||||||||||||||||||||


| ||||||||||||||||||||||||||||||||||||||||||||||||||||||||||
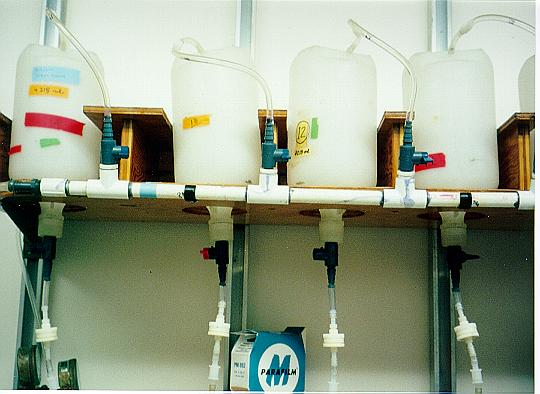
Sampling ProcedureSamples for elemental analyses of Particulate biogenic silica (PSi) were collected into 4L polyethylene carboys; filtered through 47 mm polycarbonate filter holders; onto 47 mm polycarbonate, membrane filters; and placed into 50 ml polypropylene centrifuge tubes. Time course subsamples (1.5, 3, 4.5, 6.5 and 24 hours) were measured colorimetrically to distinguish Lithogenic-Si from Biogenic-Si (DeMaster, 1981). The average field variability between duplicate analyses during 2021 are presented in the Table below.
ResultsParticulate biogenic silica (PSi) concetrations in the surface ocean over the last 25 years of the program are shown in Figure 68 and Figure 69. PSi typically ranges from < 5 to about 30 nmol kg-1 in the upper 100 m of the water column. During the summer months in 1998, 2000, 2005 and 2020, PSi increased dramatically in the upper 50 m of the water. This feature appears associated with a large bloom of diatomes, as evidenced from the sharp increases in fucoxanthin (Figure 48) | ||||||||||||||||||||||||||||||||||||||||||||||||||||||||||

