- C-MORE Home
- What is Microbial Oceanography?
- What is C-MORE?
- Research
- • Research Cruises
- » Ocean Perturbation Experiment (OPEREX)
- OPEREX Home
- Teacher-at-Sea Blog
- Science Objective
- Science Personnel
- Summary Schedule
- Operational Plans
- Equipment
- Watch Schedule
- Data Archive
- Education & Outreach
- People
- Publications
- Image Library
- Contact Us
Miriam Sutton: Teacher at Sea
Previous Entries | ||||||
| S | M | T | W | T | F | S |
| J U L | 30 | 31 | 01 | 02 | ||
| 03 | 04 | 05 | 06 | 07 | 08 | 09 |
| 10 | 11 | 12 | 13 | 14 | A U G | |
Miriam Sutton, a North Carolina middle school teacher, participated in the C-MORE/ OPEREX research cruise as a Teacher at Sea.
 During the cruise, she provideed communication and developed educational activities that assisted teachers and scientists in bringing the research project into the classroom. Her main objectives were to establish an online blog to communicate with teachers and students while at sea; develop simplified experiments that link the cruise activities to the classroom; interact and assist scientists with their research projects; and generate photo/video documentation of the research cruise.
Miriam posted a blog with images (click on the small versions to see the full versions) on this page about her experiences at sea. Feel free to email her your questions and comments. Also, as part of the Hanauma Bay Education Program, Miriam gave a presentation on Thursday, August 14, 2009, in the Hanauma Bay Nature Preserve theater about her experience. Download the flyer pdf or visit the lecture series page for details. Mahalo!
Above: Miram on board a previous reseach cruise. (Click on this and all other images to see the full versions.)
")
Miriam joined by Chief Mate of the R/V Kilo Moana, Eric Schoenberg. (Photo Credit: MSutton) |
")
A new day lies ahead on the Pacific. (Photo Credit: MSutton) |
Thursday, August 14, 2008
Mahalo!
Today, I leave the R/V Kilo Moana and prepare to return to the eastern shores of North Carolina. The experiences I have had during the past two weeks in the North Pacific have been amazing. I have been surrounded by graduate students and research scientists from every hemisphere on Earth who are passionate about the microscopic organisms that inhabit our oceans. As I disembark, I would like to extend my warmest southern gratitude to the scientists and the crew of the R/V Kilo Moana who participated in the C-MORE/OPEREX research cruise. Their generosity and willingness to share their knowledge so that others might also learn is truly commendable. Scientific research often raises more questions than answers and this is certainly the case for me. Though I have learned a lot about the ocean’s microbes, my experiences have raised many more questions about microbial oceanography and its influence on our future. As you look back through the microbial world we have visited these past two weeks, consider these few questions:
- What new technologies will be developed as scientists learn more about the biology, chemistry, and physics of our oceans? How might these new discoveries affect our lives?
- What might we learn from single-celled microbes that can utilize nitrogen from Earth’s atmosphere to generate all of the energy requirements they need for survival? Is there a future energy source just waiting to be tapped from our oceans?
- As the Genome Era explodes before us, what scientific breakthroughs might be hidden at the end of the nozzle on the Flow Cytometer?
[ Top of Page ]
")
C-MORE/OPEREX Research Science Team — KM0814 (Photo Credit: MSutton) |
Wednesday, August 13, 2008
Packing up without SID
The galley was nearly empty this morning during the breakfast call. Many of us were up late searching for SID (see August 12 entry). The ship followed a grid search pattern in hopes of picking up a signal from SID’s radio transponder while the rest of us gazed out across the vast Pacific Ocean under moonlit skies. It was finally determined that SID was lost to the sea. It was a disappointing loss, not just from the expense of the incubation array but also from the data lost in SID’s demise. One of the scientists shared a comment that is often noted on research cruises, “If you’re not prepared to lose your equipment, don’t put it in the ocean.” I have watched the scientists and crew deploy tons of highly sophisticated scientific equipment over the past two weeks and, with the exception of SID, all of the equipment has returned to the ship and is now ready to be packed away for tomorrow’s departure.
When I began this blog two weeks ago, I knew what microbes were and where many of them are found. I even knew a little about the geologic history of these single-celled organisms. But, with the generous patience of a group of scientists who shared more knowledge than my little brain could hold, I have learned much more about this microscopic world we often take for granted. Here’s your chance to assess your knowledge of the microbial world that has been so captivating during our research cruise. I’ve put a little quiz together (Teachers love a good quiz!) to provide one last challenge. Read the questions below and consider what you have learned. Feel free to look back through my blog if you need a quick reference. Just consider this an Open-Blog Quiz.
|
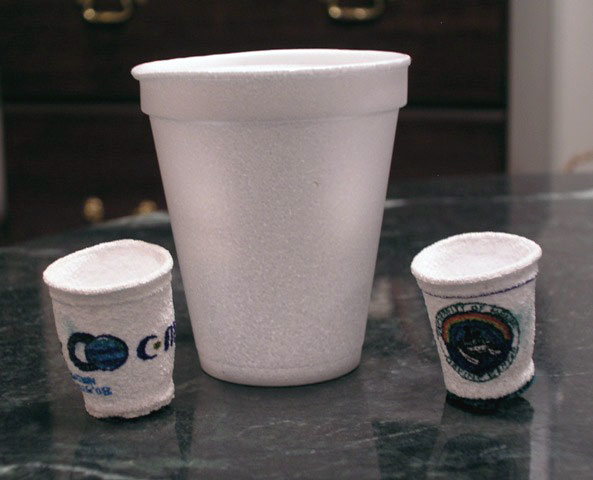
BONUS QUESTION: What will happen to these Styrofoam cups if they are attached to the CTD and lowered 4000 meters below the sea surface? Why? (Click on the image or click here to find out what happened. Were you correct?) (Photo Credit: MSutton) |
")
- What two types of cyanobacteria produce 50% of the oxygen in Earth’s atmosphere?
- What instrument allows scientists to identify, sort, and count microbes the size picobacteria?
- Name three compounds scientists are studying to better understand the chemical interactions of Earth’s biological pump.
- What are symbionts?
- What three factors affect the occurrence of plankton blooms?
- PWhat role does upwelling play in phytoplankton survival?
- Which microbes are smaller than bacteria and classified as femtoplankton?
- What is carbon fixation and what role might it play in Earth’s global climate?
- What does AUV stand for?
- Why are humpback whales so big? Find the answer from this math activity: If 1 krill eats 130,000 diatoms per day, 1 herring eats 10 krill per day, and 1 whale eats 5,000 herring per day, how many diatoms does a whale eat each day?
[ Top of Page ]
")
SID being deployed to record the progress of a plankton bloom. (Photo Credit: MSutton) |
Tuesday, August 12, 2008
We found the plankton but we lost contact with SID
Through the wonders of modern technology, I spoke with teachers and students at Waikoloa Elementary (Big Island) and Kapolei Middle School (O‘ahu) this morning using a satellite phone from the R/V Kilo Moana. It was so exciting to talk with the students and address their questions about the research being conducted onboard and my experiences as a Teacher-at-Sea. One of the questions I was asked this morning requires a revised answer this afternoon.
Do things ever go wrong when you’re at sea and if so, what do you do?
After completing this morning’s classes, I made my usual rounds on the ship, greeting the crew and checking with the scientists for updates on the research. The hot news of the day was, “We’ve lost contact with SID!”
|
Craig Taylor looks over the final coordinates sent to the R/V Kilo Moana by SID via iridium phone. (Photo Credit: MSutton) |
")
Map of SID’s track, last position recorded, and predicted position for our intercept. (Photo Credit: CTaylor) |
TS-SID (Time Series - Submersible Incubation Device) is another type of autonomous instrument that can conduct scientific incubation experiments on its own for up to a year. Craig Taylor, from Woods Hole Oceanographic Institute and C-MORE faculty member, has been monitoring SID’s progress since it was deployed from the ship last week and set to drift at sea while attached to a buoy system. SID is designed to collect water through its onboard incubation system, add the necessary chemicals to trace the primary production occurring within a plankton bloom, and download its position using an iridium transponder. When Craig failed to hear from SID, he began his troubleshooting procedures and notified the chief scientists and crew of the new development.
This is definitely an example of “things going wrong when you’re at sea.” One possible reason to the mysterious silence from SID is that the iridium transponder has failed and everything else is normal. Another possibility is that SID may have sunk for unknown reasons and is lost to the briny depths of the deep ocean. The scientists and crew came up with a new game plan in hopes of finding SID before nightfall. SID is equipped with a blinking beacon and a radio transponder that should help us in locating the instrument. Currently, we are heading toward SID’s predicted position, based on the last coordinates received from SID’s transponder and the rate of drift in the ocean currents. Tune in tomorrow to see if SID was recovered from the big blue Pacific.
[ Top of Page ]
")
Ryan deploys the Nitrogen Fixation Array for incubation. (Photo Credit: MSutton) |
Monday, August 11, 2008
Who’s Fixing the Nitrogen?
There are 26 scientists onboard the R/V Kilo Moana and they represent nine different countries. There are more accents and dialects on this ship than on a subway train in New York City. For a southern girl from North Carolina, it has truly been a cultural experience in addition to all the scientific immersion. Amid all this cultural diversity, I discovered a home grown boy from Beaufort, NC: Ryan Paerl. Ryan is a graduate student at the University of California Santa Cruz and is conducting several experiments that focus on cyanobacteria during the research cruise.
")
Flash freezing does not allow ice crystals to form and maintains the integrity of the cells for RNA and DNA testing in the lab. (Photo Credit: MSutton) |
Cyanobacteria are found in two varieties: those that can “fix” nitrogen and those that cannot fix nitrogen. Nitrogen fixation means that these bacteria can utilize nitrogen gas from Earth’s atmosphere for cellular activity and growth. Since the Earth’s atmosphere is comprised on 78% nitrogen, microbes that can fix nitrogen have an advantage over other bacteria in nutrient poor waters. Scientists are currently unsure of the total effects that nitrogen fixation has on the total marine biomass. How does nitrogen fixation affect carbon fixation? How much nitrogen and carbon fixation occurs inside and outside of these perturbation regions (i.e., eddies) the research team has been chasing? These are questions that C-MORE scientists are investigating.
The UC Santa Cruz experiments are set up to look at both nitrogen and carbon fixation rates and, like some of the other scientists onboard, Ryan is using incubation systems to measure these rates because tracking phytoplankton cell by cell is difficult in the open ocean. Once he collects water samples from the CTD (see July 31 entry), Ryan adds a nitrogen (15N2) and carbon (H13CO3) tracer to the samples. The treated samples are attached to a Nitrogen Fixation Array and deployed from the ship to drift at five subsequent depths during the 24-hour incubation period. After incubation, the water samples are filtered, flash frozen, and stored in a freezer for follow-up mass spectrometer analysis. Mass spectrometry vaporizes the incubated samples so the unused particles of 15N2 and H13CO3 tracer can be counted. The mass spectrometer results are compared to the original amount of tracer Ryan added to the samples before incubation. The results not only provide scientists with an idea of who’s fixing the nitrogen, but also an estimation of their impact to the biogeochemical cycle in the ocean (see August 07 entry).
")
Synechococcus play a major role in recycling carbon throughout Earth\92s biological pump. (Photo Credit: C.Osolin, Lawrence Berkeley National Laboratory) |
Ryan is also looking at Synechococcus, a type of picocyanobacteria that, like Prochlorococcus (see August 09 entry), is not capable of fixing nitrogen. Synechococcus (Sin'-eh-ca-cah'-cus) needs nitrogen that has been converted into nutrients, like nitrate (NO3). Synechococcus are also abundant throughout the oceans and have been observed at latitudes between 60° South and 60° North. Their large biomass, and their ability to assimilate (digest) lots of nitrate, makes Synechococcus a key marine microbe in the recycling of nutrients. Ryan is adding a nutrient tracer, nitrate (15NO3), in hopes of learning how Synechococcus assimilates this nutrient and contributes to the biological pump. Follow-up studies will also include DNA and RNA extraction to match currently known gene sequences that identify the populations of picocyanobacteria found in the sample.
[ Top of Page ]
 has been providing water column data for the scientists during the research cruise (Photo Credit: MSutton)")
The AUV (sea glider) has been providing water column data for the scientists during the research cruise. (Photo Credit: MSutton) |
")
An Iridium telephone attached to the sea glider allows scientists to communicate with the glider during a surface interval at sea. (Photo Credit: MSutton) |
Sunday, August 10, 2008
Sea Gliders Rule!
I met my first sea glider, a type of Autonomous Underwater Vehicle (AUV), during a summer workshop at the Rutgers University Marine Field Station. I was working with a group of scientists from R.U.C.O.O.L. (Rutgers University Coastal Ocean Observatory Lab) as they launched a couple of sea gliders off the southern coast of New Jersey. My second experience with sea gliders is occurring during this research cruise with Steve Poulos from the University of Hawai‘i at Manoa. Steve launched a sea glider earlier in our cruise and has continued to monitor its progress over the past several days (see August 03 entry). The crew of the R/V Kilo Moana also assisted Steve to retrieve a second sea glider that was completing a 2-month mission during our cruise.
Sea gliders are amazing. They are like untethered swimming robots that can dive and surface across an ocean, collecting data from the surface to a depth of 1000 meters. An Iridium phone is installed in the glider’s communication system that allows the sea glider to upload data and download instructions. It’s like “ET Phone Home” and there’s the data. Steve can use an Iridium phone on the R/V Kilo Moana to send the sea glider’s new instructions to the base on O‘ahu. When the sea glider surfaces and calls the base station, the instructions are downloaded and the glider continues diving up and down for days, weeks, or months at a time. The sea glider also has a GPS system to locate its direction. When the sea glider completes the mission, it can surface for a retrieval operation at sea or receive directions to travel to the home port on O‘ahu where it is prepared for the next mission.
")
Backscatter data, transmitted by the sea glider, is an indication of large particles in the water column. (Photo Credit: SOEST) |
Steve has programmed the sea glider to follow particular latitude and longitude coordinates while continuously recording dissolved oxygen, chlorophyll, conductivity, and temperature between the surface and 500 meters. You can access the sea glider data being collected from our research cruise at this website and following the directions below:
Go to the ALOHA SeaGliders page Look for the DATA LINKS section (bottom-left margin) and select View Dive Profiles. The current profile transmitted from the sea glider will appear on the next screen. You can make comparisons to previous profiles recorded by the sea glider by clicking the Previous Dive button below the graphs.
[ Top of Page ]
")
Microscopic view of Prochlorococcus (Photo Credit: C.Ting, Williams College) |
")
Bacteria are classified as “picoplankton” and range in size from 1 micrometer to 0.1 micrometer. (Photo Credit: A.deCharon, Bigelow Laboratories, Inc.) |
")
Ken Doggett observes computer-generated histograms illustrating various species on picocyanobacteria. (Photo Credit: MSutton) |
Saturday, August 09, 2008
Introducing, “Prochlorococcus”
Prochlorococcus’ Claims to Fame:
- Smallest known photosynthetic organism
- Smallest genome of any photosynthetic organism
- Account for 80% of ocean’s phytoplankton biomass
Scientists from the University of Hawai‘i at Manoa are studying these unique microbes that were only discovered about 20 years ago. Scientists do not consider Prochlorococcus (Pro'-clor-ah-cah-cus) to be a new species but rather a newly discovered species resulting from new technologies that can actually identify microbes as small as 0.1 micrometer. The only classification of plankton smaller than picoplankton is femtoplankton, which includes viruses. Viruses are typically smaller than 0.1 micrometer. (Keep in mind that the average width of a human hair is 50 micrometers.)
The instrument being used to identify these miniscule microbes, referred to as picocyanobacteria, is the Flow Cytometer. Flow Cytometry begins by separating each microbe in the water sample by sending them through a flow nozzle at a cruising speed of 500 cells per second. Once separated, a laser beam of light hits each cell and creates a scatter of light signals. Each type of microbe emits a specific pattern of light that can be used for identification. Once identified, the Flow Cytometer counts and sorts the microbes into a tube for other experiments and cultures.
")
Karin Björkman incubates treated water samples before analyzing phosphorus uptake. (Photo Credit: MSutton) |
The abundance of Prochlorococcus in the Earth’s oceans, characterized by its ability to survive throughout the top 200 meters (Euphotic or sunlit zone) of any ocean between the latitudes of 40° South and 40° North, has scientists curious about its impact on the Earth’s biological pump (see August 07 entry). Inorganic phosphorus is very low in these ocean regions, so how do these tiny organisms compete for phosphorus with all the other microbes and successfully establish a stable population? Karin Björkman (University of Hawai‘i at Manoa) is exploring this concept by determining picocyanobacteria’s use of phosphorus during photosynthesis. After collecting water samples from the CTD, Karin adds radioactive phosphorus (32P) as a tracer and incubates the samples. The incubated samples are filtered to separate the picocyanobacteria from the larger phytoplankton and then analyzed, using the 32P tracer, to determine the amount of phosphorus used during photosynthesis. She is hoping the results will provide another link to the role phytoplankton play in the Earth’s biological pump.
[ Top of Page ]
")
Water samples are analyzed daily to observe changes in the microbial physiology. (Photo Credit: MSutton) |
Friday, August 08, 2008
Enrichment Bio Assays (AKA: Incubation Experiments)
I’ve watched Alan Foreman, (Monterey Bay Aquarium Research Institute (MBARI), California), for the past week as he monitored the progress of the Incubation Experiments secured on the top deck of the ship. Every morning at sunrise and every evening at sunset, Alan takes water samples from each of the twenty-four 20 Liter bottles set up inside the incubation containment systems. I’ve nicknamed one of the incubation systems the “Houdini Box” because it reminds me of one of Harry Houdini’s underwater escape devices. Alan told me the box was designed by Jonathan Karp, who also works at MBARI.
")
The Fast Repetition Rate Fluorometer measures the photosynthetic properties of the microbes living in the incubation systems. (Photo Credit: MSutton) |
Their experimental design includes three incubation systems stationed on the top deck and fourth incubation system mounted inside one of the science labs. Sasha Tozzi (MBARI) and Alan use a Fast Repetition Rate Fluorometer (FRRF) to analyze the samples from each system. The FRRF was designed by the Chief Scientist of this research cruise, Zbigniew Kolber (MBARI) and Paul Falkowski (Rutgers University). The FRRF uses variations in fluorescence to assess how the phytoplankton use light, nutrients, and carbon dioxide during photosynthesis.
Incubation System #1 is designed to test the effects of upwelling (which brings nutrients to the surface) by mixing water collected at 45 meters with water collected at 500 meters. This experiment is also measuring the effects of increased levels of carbon dioxide (pCO2) by simulating the projected carbon dioxide concentration for Earth’s atmosphere in a hundred years from now. Incubation #2 and #3 are also simulating the effects of nutrient upwelling but are also controlling the amount of light available to the microbes for photosynthesis. One system is limited to 40% of the surface light and the other system is limited to 16% of the surface light.
")
The Chemostats Lab is controlled and monitored by computers and requires less space and equipment than the incubation systems on deck. (Photo Credit: MSutton) |
The MBARI science team is also testing a new apparatus that simulates some of the same environmental controls as the incubation systems. The Chemostats Lab looks like something from the disco floor with its blue fluorescent lights flashing a tango beat for the little microbes trapped inside. This computerized system controls light and temperature on a timed sequence that duplicates the microbes’ natural environment in the ocean. An attached FRRF continuously measures the microbes’ photosynthetic rates or “happiness” while also monitoring pH and temperature. Boogie Down, Microbes!
[ Top of Page ]
")
Terrestrial Food Web (Photo Credit: A.deCharon, Bigelow Laboratory for Ocean Sciences) |
")
Aquatic Food Web (Photo Credit: A.deCharon, Bigelow Laboratory for Ocean Sciences) |
Thursday, August 07, 2008
“Why study phytoplankton?”
I received this question yesterday from a student in Hawai‘i. The answer begins with your breakfast meal this morning. Did you have cereal, fruit, milk, or maybe even some pancakes with bacon? While you were meeting all the nutritional requirements from the food pyramid, did you stop to think about the importance of plants in your diet? Let’s look at your breakfast choices from the plant’s perspective. Cereal: wheat, rice, and corn. Fruit: trees and bushes. Milk: grasses to feed the cows. Pancakes: wheat for the flour. Bacon: grains to feed the pigs. Plants are primary producers and are vital to our food web. Plants also provide 50% of the oxygen to our atmosphere.
Phytoplankton are the plants of the sea. They add sunlight to the carbon dioxide and nutrients absorbed from the ocean and produce the other 50% of the oxygen in our atmosphere. Phytoplankton are microscopic and live for only a day or two. As a result, the turnover rate between absorbing nutrients (for photosynthesis) and respiring nutrients (during cellular respiration) is much faster for phytoplankton than the exchange rate in larger land plants which may take several weeks, months, or years to grow. The scientists on the R/V Kilo Moana want to learn more about phytoplankton’s ability to obtain and use the nutrients which they are absorbing from the atmosphere and ocean. They also want to study factors that affect the availability of these nutrients for microbial growth and reproduction. Some of the nutrients being investigated during this research cruise include carbon, nitrogen, and phosphorus. These elements are key components in the ocean’s “biological pump,” or biogeochemical cycle, as the phytoplankton interact with the atmosphere and ocean. Bio means life, geo means earth, and chemical refers to the chemical reactions that occur between the microbial life in the oceans and the Earth’s atmosphere. Phytoplankton’s location at the surface of this interactive zone makes them key indicators for changes in Earth’s climate. The OPEREX research study will help us to understand the impact these ocean microbes have on ocean productivity, including the food webs, and how these microbes may be affected by the changes occurring in our global climate.
Today’s Activity: Weaving a Food Web
")
Phytoplankton are vital to the ocean biological pump, recycling inorganic material into organic material (Photo Credit: E.Webb, Woods Hole Oceanographic Institute) |
Terrestrial and Aquatic Food Webs often overlap with each other. Use the illustrations shown in today’s blog and other resources available to you (e.g.; encyclopedia, textbook, Internet) to illustrate a Food Web that includes interactions between the terrestrial and aquatic food webs. Be sure to include terrestrial and aquatic primary producers, primary consumers, secondary consumers, and decomposers. Also, include a mixture of herbivorous, carnivorous, and omnivorous consumers.
Your completed drawing should illustrate the importance of plants and phytoplankton to the food web and to our atmosphere. What would happen if you removed one of the producers or consumers from your food web?
[ Top of Page ]
")
Satellite view showing numerous eddies in the North Pacific. (Photo Credit: MSutton) |
 eddy; Yellow indicates an anti-cyclonic (clockwise) eddy. The convergence is the green between the eddies. (Photo Credit: MSutton)")
Blue indicates a cyclonic (counter- clockwise) eddy; Yellow indicates an anti- cyclonic (clockwise) eddy. The convergence is the green between the eddies. (Photo Credit: MSutton) |
Wednesday, August 06, 2008
Chillin’ in the Eddies
- Chillin’ in the Eddies
- On the big blue Pacific,
- Casting out our CTD
- In search of something terrific.
- We’ve been checking all the indicators
- From new to crescent moon.
- There’d be cause for celebration
- If the plankton would only bloom.
The R/V Kilo Moana has been stationary most of the day. The scientists have identified an area of convergence between two eddy currents occurring in this region of the ocean. A convergence occurs when a large group of water molecules is moving in an anti-cyclonic clockwise direction and close to another group of water molecules that is moving in a cyclonic counter-clockwise direction. The two rotations produce eddies that create differences in the sea surface height and results in a convergence between the eddies. Where there is convergence, there is mixing between the nutrient-rich deep water and the sunlit surface water. When you mix nutrients, sunlight, and carbon dioxide, phytoplankton can flourish. Based on all the data the scientists have been analyzing, the R/V Kilo Moana is positioned for a possible phytoplankton bloom. All we can do now is wait and see if a bloom occurs.
")
|
Sometimes I struggle with patience; it hasn’t always been one of my virtues. But, when you’re hanging out on the big blue ocean, watching a crescent moon rising in the east and a blazing sun setting in the west, patience isn’t so hard to come by.
Sunset at Sea (Photo Credit: MSutton)
[ Top of Page ]
")
The density of seawater increases with depth. (Photo Credit: L.Guidi) |
Tuesday, August 05, 2008
It’s Time for a U-ee!
I’ve always loved a good U-turn. When you’re driving down the road, singing a tune or having a conversation and you suddenly realize you missed something along the way. You correct your oversight with one smooth sweeping motion and, before you know it, you’re back on course. After completing our 16-station survey transit late yesterday, the scientists met again to review the results of the water samples and to determine our next course of action. The scientists had surveyed several indicators along the transit, including chlorophyll, temperature, salinity, and density. They generated a time-series graph to illustrate changes observed in these variables and used this data, in addition to updated satellite images, in their decision-making process.
The highest hope of this research cruise is to observe phytoplankton from the time they form a flourishing bloom in the ocean until the bloom dies out. The scientists realize they may complete their 2-week cruise without achieving this goal but they are committed to giving it their best shot. A couple of areas looked promising during our recent survey transit and the scientists decided to return to these today. The first location was only a few miles behind us but follow-up samples failed to indicate a bloom in progress. After lunch, we headed further south to assess the other location. We’ve been cruising all afternoon and the downtime has allowed the scientists to recover from the intense surveying and sampling schedule they completed through the weekend. There’s nothing like a good U-ee to slow things down for a moment.
Science Question:
Why does seawater become denser as depth increases in the ocean?
[ Top of Page ]
")
Jason Hilton, from the University of California Santa Cruz, uses different wavelengths through his microscope to observe symbionts living with diatoms. (Photo Credit: MSutton) |
Monday, August 04, 2008
Ah! The Symbionts
The R/V Kilo Moana continued to transit through the night and all day today, stopping every couple of hours to complete another “cast” for water with the CTD. When this 36 hour transit is completed, the scientists will have water samples for every 20-mile interval across more than 200 nautical miles (~224 land miles) of ocean. The scientists have been collecting and analyzing water samples around the clock, with only a few short breaks and naps in between. I can see the fatigue in their faces. I can also see the dedication to their research.
I realized a few days ago, after talking with the different scientists onboard, that very few of them are actually studying one particular group of phytoplankton. Most are measuring chemical or physiological interactions occurring within the biomass (the biomass being all the phytoplankton collectively observed in each sample). However, a few of the scientists are looking specifically at certain microbes. Ben Li, from the University of Hawai‘i at Manoa (see August 2 entry), and Jason Hilton, from the University of California Santa Cruz (above right), are focusing their research on microbes known as diatoms. Jason is actually looking at the relationship between certain species of diatoms and their symbiotic relationship with cyanobacteria. One of these groups of diatoms is Chaetoceros (Kah-tahs'-ah-ross).
")
Microscopic view of Chaetoceros (Photo Credit: JHilton) |
")
Epifluorescent view of Chaetoceros (Photo Credit: JHilton) |
Symbiotic relationships occur quite often in nature when two different species exist together. One of the best known symbiotic relationships exists between the clownfish and sea anemones, like the clownfish named “Marlin” from the movie, Finding Nemo. Jason is studying the symbiotic relationship between the cyanobacteria (the symbiont) and the diatom (the host). It is not known which phytoplankton derives the most benefit from this relationship. That is one of the things Jason hopes to determine with his research.
Using a microscope, the cyanobacteria can be seen living with some species of diatoms but not all species have established the symbiotic relationship. The epifluorescent scope provides more detail on where the symbionts are living.
[ Top of Page ]
")
Like all living things, phytoplankton has a life cycle (Photo Credit: RStewart; Texas A&M University) |
")
Scientists on the R/V Kilo Moana are searching for various types of phytoplankton (Photo Credit: CGallegos; Smithsonian Environmental Research Center) |
Sunday, August 03, 2008
Changing Course
The phytoplankton bloom that had all the scientists so excited two days ago disappeared late Saturday. After dinner, the scientists met to discuss the new plan of action. The choices were: 1) Stay where we are and see if a new plankton bloom occurs; or 2) Transit to a new location in hopes of finding another plankton bloom. The scientists expressed concerns for staying at our current location; primarily that the recent plankton bloom we experienced resulted in a depletion of the nutrients needed for another bloom. It’s like watching a bird feeder after the birds have eaten all the seeds. No bird seed, no birds. No nutrients, no phytoplankton. After reviewing more satellite data, the decision was made to transit to a new location. This led to the next big question: Which way should we go in this big blue ocean to find another plankton bloom?
Phytoplankton are the plants of the sea and they need sunlight, nutrients, and carbon dioxide to produce energy through photosynthesis. Carbon dioxide is readily available in the ocean but sunlight and nutrients vary over time. Sunlight changes daily and seasonally and is also affected by weather conditions. Nutrients, like nitrates and phosphates, also vary in their concentration throughout the ocean. As phytoplankton dies and decomposes, it sinks lower in the water column. The decomposed material accumulates in the seawater and creates a denser nutrient-rich layer several meters below the ocean’s surface. In the open ocean, phytoplankton must rely on wind and waves to force the deeper nutrient-rich water toward the surface where sunlight can be added and the life cycle of phytoplankton can continue.
")
Glider being deployed to collect chemical and physical data throughout the water column (Photo Credit: MSutton) |
The scientists are continually monitoring satellite and shipboard data to analyze wind, wave, and chlorophyll patterns that might indicate another plankton bloom location. They even deployed an Autonomous Underwater Vehicle (AUV) known as a “glider” to collect more data on our transit area. I’ll talk more about the glider in a later entry.
It’s amazing to see the types of technology scientists use to find these tiny microscopic creatures. As the R/V Kilo Moana transits toward our new location, the scientists continue to collect water samples and look for changes that might indicate a bloom is in progress. Wish us luck!
Post Your Plankton Bloom Results
Record your final (DAY 4) observations from Thursday’s experiment. Look back over your predictions and write a summary based on your findings. Let me know your results. Did you produce a plankton bloom? If so, email a photo of your plankton bloom using the email posted on this website. Be sure your images are reduced (“small web” or equivalent, about 300x400) and in a jpeg format.
[ Top of Page ]
")
Water filtration systems are used to concentrate particles for further study. (Photo Credit: MSutton) |
Saturday, August 02, 2008
What’s In All That Water?
Many of the scientists are siphoning water samples collected with the CTD (see July 31 entry) through small filtration systems. Each filtration system siphons water from the containers through tubes with filters attached at the end.
")
Filters may be different colors to provide contrast for different particles. (Photo Credit: MSutton) |
The filters are about the size of a quarter and range from .2 microns to 10 microns, designed to collect different size particles or organisms. The scientists will siphon up to 4 liters of water through one filter to increase the concentration of the particles on the filters for their investigations.
 Li, from the University of Hawai'i at Manoa, removes a filter from his diatom filtration system (Photo credit: MSutton)")
Binglin (Ben) Li, from the University of Hawai‘i at Manoa, removes a filter from his diatom filtration system (Photo credit: MSutton) |
Once the filtration process ends, scientists remove the filters to more closely examine the particles left behind. Knowing the size of the microbes being studied enables the scientists to select the filter size that will collect the organisms they are investigating.
Today’s activity will simulate the filtration process being used onboard and allow you to create your own investigation of particles that are found in a water source near your home. As always, be sure an adult is with you when you collect your water sample.
Today’s Activity: Investigate Filtration Systems
Collect 2 liters of water from a local water source (e.g., pond, stream, lake, or bay). Try to collect some of the bottom sediment with your water sample. Place your water sample aside and set up your filtration system as described below:
- Filtration System #1: Place a cooking strainer over Bowl #1
- Filtration System #2: Place a layer of cheese cloth over Bowl #2
- Filtration System #3: Place a coffee filter over Bowl #3
In this investigation, you will observe the filtration capacity of these three different filtration systems. Observe your lab set up and make your predictions based on the following:
- Will the three filtration systems trap particles differently? If not, why? If yes:
- Which system will filter the water at the fastest rate? Why?
- Which system will filter water at the slowest rate? Why?
- Which system will trap the most particles? Why?
- Which system will trap the least particles? Why?
- Will your filtration system trap all the particles suspended in the water sample? Why?
Once you have completed your predictions, gently mix your water sample by shaking the container. This will suspend the particles into the water column. Be sure to mix your water sample before each pour. Pour 250mL of your sample through Filtration System #1. Pour 250mL of your sample through Filtration System #2. Pour 250mL of your sample through Filtration System #3. Make observations of each filter and draw an illustration of the particulate matter observed on each filter.
Repeat the filtration system procedure again by pouring 250mL of your sample through each of the three filtration systems. Once again, illustrate your observations for each filter. Were the particles more concentrated after the second pour?
Review your predictions and record your findings. What instruments could help you determine if more particles are still suspended in your filtered water?
REMINDER: Don’t forget to record your DAY 3 observations from Thursday’s experiment. Is today a blooming day?
[ Top of Page ]
")
Plankton bloom being swirled into eddies by the ship thrusters (Photo Credit: MSutton) |
Friday, August 01, 2008
The Plankton is Blooming! The Plankton is Blooming!
“Grab your camera and meet me at the bridge!” was all Junior Chief Scientist Allison Fong said to me as we crossed paths on the ship this afternoon. I could sense the excitement as I made my way to the ship’s bridge (the room from which the ship is steered). I had no idea what I would see but I knew it must be something big. And, there it was—larger than any whale or other sea creature I had ever seen—Trichodesmuim, (pronounced Trick'-ah-dez-me-um), blooming all around us out in the middle of the Pacific Ocean. Individually, these bacteria are microscopic but when they get together by the billions, they form huge blooms of plankton, drifting along in the ocean’s surface currents. I realized instantly why plankton blooms are often referred to as “red tides.” These single-celled bacteria were clumped together so tightly that the seawater appeared to be stained a reddish-brown color (see photo).
")
Plankton net trawling behind the R/V Kilo Moana. (Photo Credit: MSutton) |
")
Microscopic view of Trichodesmuim (Photo Credit: RPaerl) |
Trichodesmuim are one of the thousands of species of cyanobacteria. Based on Earth’s fossil record, cyanobacteria are thought to be the first living organisms on our planet. One of the scientists most excited about the Trichodesmuim bloom was Katie Watkins, from Oregon State University. Within minutes, Katie had her plankton net ready for deployment to see how many of the microbes she could catch.
Once the net was retrieved, Katie took her catch to the microscope lab to investigate these blooming bacteria. Specifically, Katie is researching how the Trichodesmuim store phosphorous.
REMINDER: Don’t forget to record your DAY 2 observations from yesterday’s experiment. Are your plankton blooming yet?
[ Top of Page ]
")
Satellite image of OPEREX research area. (Image Credit: C-MORE) |
Thursday, July 31, 2008
We’re Chasing Plankton
The scientists onboard are conducting a variety of experiments, all of which require participants from the microbial world. These scientists need the little microscopic critters that inhabit the Earth’s oceans. So, how do you find critters that exist on a scale where a million of them could fit in a teaspoon and you’re looking in an ocean? Satellites start the search by measuring how much light is reflected from the water’s surface. Plant plankton, known as phytoplankton (fi'-toe-plank-ton), contains chlorophyll and absorbs sunlight that reaches the ocean surface. When less light is reflected, the satellite data indicates the presence of plankton. The satellite image shown here is being used by the R/V Kilo Moana crew to navigate the scientists toward the plankton.
The first plankton sample was taken this morning at 2:00AM and sampling will continue throughout the research cruise. Sampling is completed using an instrument called a “CTD,” which stands for Conductivity, Temperature, and Depth. Long sampling tubes are mounted around the CTD sensors, which are located in the center of the instrument. A winch, mounted on the deck of the ship, is used to deploy the CTD and lower it to the designated depth in the water column. Once the CTD is brought back to the ship, the scientists can collect their water samples and begin their experiments.
")
Scientists collecting water samples from the CTD. (Photo Credit: MSutton) |
As we transit toward the more concentrated areas of chlorophyll (and phytoplankton), we will approach a plankton “bloom.” Blooms are highly concentrated populations of phytoplankton. Create your own plankton bloom over the next few days by completing “Today’s Activity” posted below. (Be sure an adult is with you when you visit a pond to collect your water. Remember: Safety First!)
Today’s Activity: Create a Plankton Bloom
Collect 1/2 liter (about 2 cups) of pond water in a glass jar. Place the uncovered jar on a window sill for 4 days and observe the changes each day. Use a table like the one below to assist you with your data collection:
Observations |
DAY 1 |
DAY 2 |
DAY 3 |
DAY 4 |
Illustrations |
|
|
|
|
Notes |
|
|
|
|
Prediction Questions:
- Will there be change in the water color?
- Why or why not?
- How can you measure a change in color?
- Will there be a change in the volume of the water?
- Why or why not?
- How can you measure a change in volume?
- Will there be a change in the pH of the water?
- Why or why not?
- (OPTION: Use Swimming Pool test strips to measure the pH each day.)
- How will you determine if a plankton bloom has occurred?
[ Top of Page ]
")
R/V Kilo Moana ready to disembark. |
")
Sleeping Bunks. |
")
Locker storage and Safety Gear. (All photo credits: MSutton) |
Wednesday, July 30, 2008
Aloha from the R/V Kilo Moana!
Welcome to my Hawaiian Teacher at Sea Adventure with the scientists from the Center for Microbial Oceanography: Research and Education (C-MORE). Over the next two weeks, I’ll share my experiences onboard the Research Vessel Kilo Moana as I sail with 27 scientists, and the crew of the R/V Kilo Moana. Each day I will post journal entries and photos describing and illustrating the research being conducted at sea. Feel free to email questions and comments during my journey and share in the experience of living and conducting scientiific research at sea.
I explored the ship during my first day onboard to help me get oriented to where all the different scientists would be working and where other important rooms were located. Finding the galley is always a top priority on a ship. The galley is where the food is served and each ship has its own serving hours. Being late for meals is not a good option. I’ve added a couple of photos from my room to give you a sense of life at sea.
Once the ship set sail from Honolulu, the captain reviewed the standard procedures we need to follow while onboard the research vessel. After the captain’s meeting, we practiced safety drills so we would be prepared in case of a fire onboard or in the event that we might have to abandon the ship while at sea. As the sun was setting across the Pacific Ocean, the scientists were preparing for the research mission which begins at 2:00AM tomorrow morning. See you then!
[ Top of Page ]
![]()

![]() SOEST Home |
Directory |
Education |
Research |
Facilities & Technology |
Public Resources |
News |
Contact SOEST
SOEST Home |
Directory |
Education |
Research |
Facilities & Technology |
Public Resources |
News |
Contact SOEST
Comments or questions about this page go to bays@hawaii.edu.