- C-MORE Home
- What is Microbial Oceanography?
- What is C-MORE?
- Research
- • Research Cruises
- » Ocean Perturbation Experiment (OPEREX)
- OPEREX Home
- Teacher-at-Sea Blog
- Science Objective
- Science Personnel
- Summary Schedule
- Operational Plans
- Equipment
- Watch Schedule
- Data Archive
- Education & Outreach
- People
- Publications
- Image Library
- Contact Us
Science Objective
To explore the potentials and limitations of perturbation experiments at sea.
Goals:
- Following local blooms and features
- Eddy sampling experiments
- Ship deck incubation experiments
- Ship lab incubation experiments
- pH shift experiments
Rationale
To develop experimental tools for predicting responses of microbial communities to physical and chemical forcing.
Approach
We will try to observe and interpret natural perturbations such as local blooms and eddies. We will also perform, observe, and interpret artificial perturbations including ship-deck incubations, and lab-scale manipulation experiments.
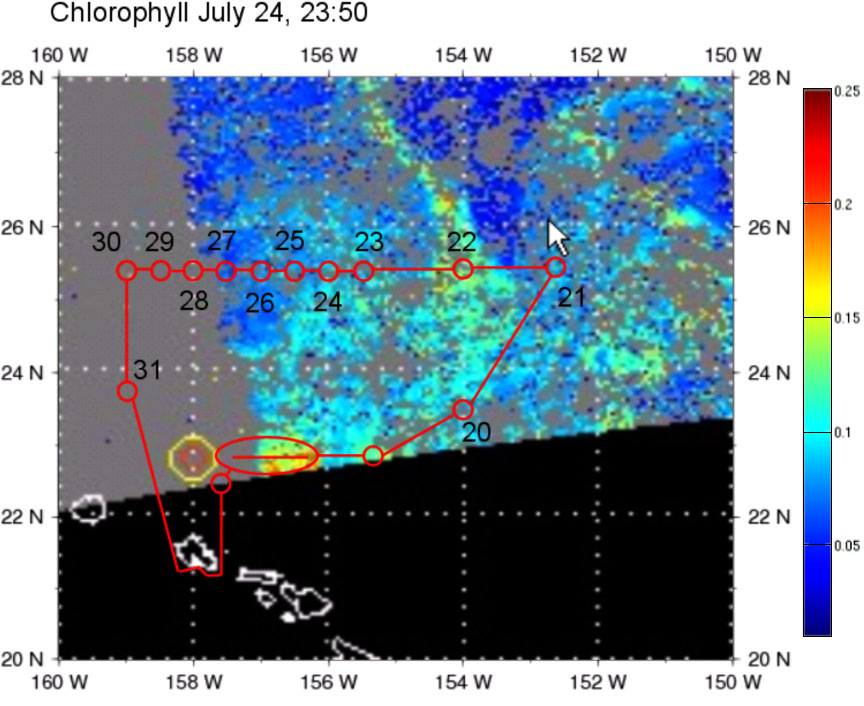
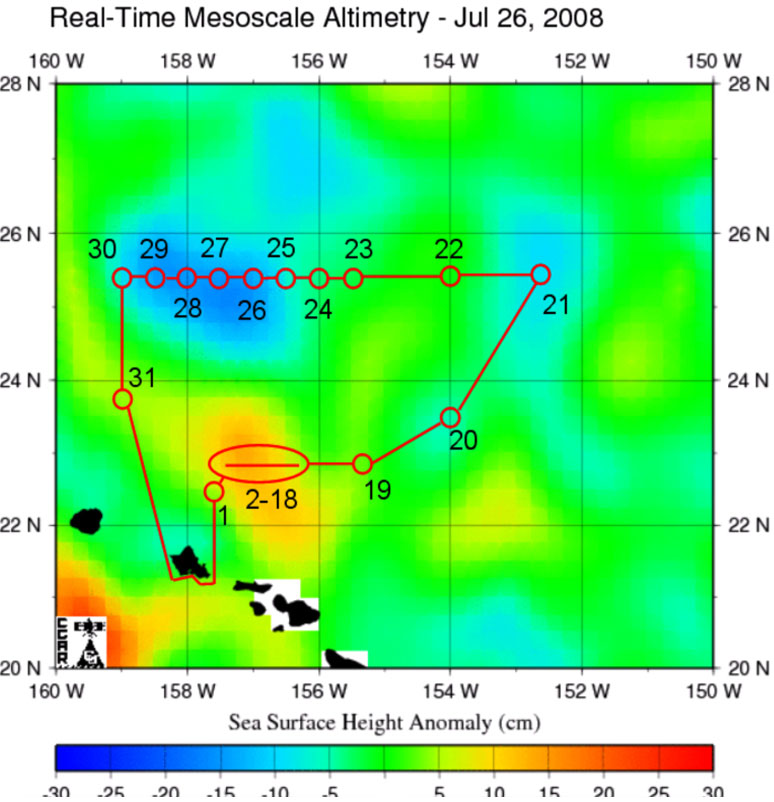
Scientific Operations
|
Transect / Stations |
Time / Station |
Activities |
|
Hawai‘i |
July 30, 08:00 |
Underway thermosalinograph, fluorometry, FRRf |
|
22.50N, 157.50W |
Station 1: Upwelling eddy |
Min core CTD/ Science CTD, two casts for deep water enrichment, one cast for DOM incubation |
|
22.50N, 157.50W |
July 31, 02:30 |
Underway thermosalinograph, fluorometry, FRRf |
|
22.75N, 157.00W |
Station 2-18 |
Bloom location. Extensive sampling of bloom spatial characteristics, 40+ CTD casts (Min/Full core & Science), sediment traps deployment, SID deployment, pumping CTD operation, Deep water enrichment, Nitrogen fixation, Herve's floats deployment |
|
22.75N, 157.00W |
Aug 08, 23:00 |
Underway thermosalinograph, fluorometry, FRRf |
|
22.75N, 155.20W |
Station 19: Downwelling eddy |
Full Core CTD/Science CTD |
|
22.75N, 155.20W |
Aug 09, 12:30 |
Underway thermosalinograph, fluorometry, FRRf |
|
23.50N, 154.00W |
Station 20: Upwelling eddy |
Full Core CTD/Science CTD |
|
23.50N, 154.00W |
Aug 10, 00:00 |
Underway thermosalinograph, fluorometry, FRRf |
|
25.50N, 152.50W |
Station 21: Downwelling eddy |
Full Core CTD/Science CTD |
|
25.50N, 152.50W |
Aug 10, 18:00 |
Underway thermosalinograph, fluorometry, FRRf |
|
25.50N, 154.00W |
Station 22: Downwelling eddy |
Min Core CTD/Science CTD |
|
25.50N, 154.00W |
Aug 11, 04:00 |
Underway thermosalinograph, fluorometry, FRRf |
|
25.50N, 155.50W |
Station 23: Upwelling eddy |
Full Core CTD/Science CTD |
|
25.50N, 155.50W |
Aug 11, 15:30 |
Underway thermosalinograph, fluorometry, FRRf |
|
25.50N, 156.00W |
Station 24: Eddy sampling 1 |
Min Core CTD/Science CTD |
|
25.50N, 156.00W |
Aug 11, 20:30 |
Underway thermosalinograph, fluorometry, FRRf |
|
25.50N, 156.50W |
Station 25: Eddy sampling 2 |
Min Core CTD/Science CTD |
|
25.50N, 156.50W |
Aug 12, 01:30 |
Underway thermosalinograph, fluorometry, FRRf |
|
25.50N, 157.00W |
Station 26: Eddy sampling 3 |
Min Core CTD/Science CTD |
|
25.50N, 157.00W |
Aug 12, 06:30 |
Underway thermosalinograph, fluorometry, FRRf |
|
25.50N, 157.50W |
Station 27: Eddy sampling 4 |
Full Core CTD/Science CTD |
|
25.50N, 157.50W |
Aug 12, 13:00 |
Underway thermosalinograph, fluorometry, FRRf |
|
25.50N, 158.00W |
Station 28: Eddy sampling 5 |
Min Core CTD/Science CTD |
|
25.50N, 158.00W |
Aug 12, 18:00 |
Underway thermosalinograph, fluorometry, FRRf |
|
25.50N, 158.50W |
Station 29: Eddy sampling 6 |
Min Core CTD/Science CTD |
|
25.50N, 158.50W |
Aug 12, 23:00 |
Underway thermosalinograph, fluorometry, FRRf |
|
25.50N, 159.00W |
Station 30: Eddy sampling 7 |
Min Core CTD/Science CTD |
|
25.50N, 159.00W |
Aug 13, 04:00 |
Underway thermosalinograph, fluorometry, FRRf |
|
23.75N, 159.00W |
Station 31: Eddy sampling 8 |
Full Core CTD/Science CTD |
|
23.75N, 159.00W |
Aug 13, 18:00 |
Underway thermosalinograph, fluorometry, FRRf |
|
21.30N, 158.80W |
Aug 14, 08:00 |
Arrive Snug Harbor, Unload ship |
|
NOTE:
| ||
|
|
|
[ Top of page ]
![]()

![]() SOEST Home |
Directory |
Education |
Research |
Facilities & Technology |
Public Resources |
News |
Contact SOEST
SOEST Home |
Directory |
Education |
Research |
Facilities & Technology |
Public Resources |
News |
Contact SOEST
Comments or questions about this page go to bays@hawaii.edu.