- C-MORE Home
- What is Microbial Oceanography?
- What is C-MORE?
- Research
- • Research Cruises
- » BioLINCS
- Home
- Cruise Participants
- Instruments Used
on the Cruise - Nitrogen Cycling
- Marine Microbes
- Cruise Blog
- Data Archive
- Education & Outreach
- People
- Publications
- Image Library
- Contact Us
| |||||||||||||||||||||||||||||||||||
BioLINCS Cruise Blog
Saturday, September 17, 2011
|
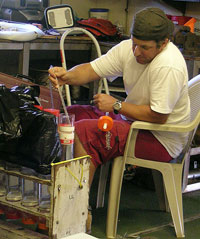
Blake Watkins siphons seawater out of the top of a sediment trap. This is one of the first steps taken to process each of the 144 sediment traps that were recovered before dawn this morning. |
|
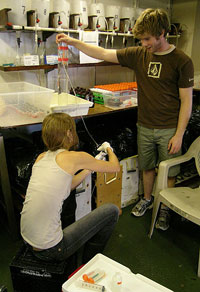
In the second stage of processing a sediment trap, Daniela del Valle and Ben Rubin use a siphon to collect subsamples of fluid from the trap. These subsamples will be used for chemical and DNA analyses |
|
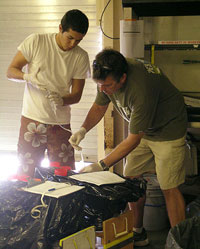
At the third stage in the sediment-trap processing line, Ariel Rabines and Ken Doggett add preservative to sediment traps, to prevent the organic material inside from decomposing. |
|
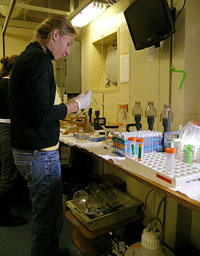
Tara Clemente analyzes material from the sediment traps for chemicals that indicate how actively the microbes in the sample are growing and reproducing. |
|
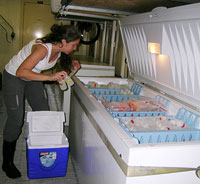
Once samples from sediment traps have been processed and/or preserved, they can be stored for later analyses. In this photo, Mariona Segura places sample bottles in a freezer that is kept at minus 80° Celsius. This preserves organic material in the sample for later DNA analysis. |
Last night was a big Friday night on the Kilo Moana, but not in the way you might think. The team from the University of Hawai‘i (UH) pulled off what I’m calling “The Night of the Living Sediment Traps.” The marathon started at around three this morning. As I write this, around 7:30 in the evening, the radios are still blaring in the lab, and most of the participants are still working away.
Before dinner, it looked as though we might have a collection of zombies on our hands. Now they’ve had a break for dinner, and are in the home stretch. I just heard someone say that they had started processing the last sample… for today.
The samples came on board around four AM, with the recovery of the Lagrangian sediment traps. These sediment traps had been drifting around the ocean since September 9, collecting tiny bits of sinking debris (and in one case, a small fish).
As I described in my September 9 blog entry, each trap consists of a clear plastic tube about 18 inches long. The bottom of each tube is sealed. The top is open and faces upward, toward the sea surface. Before being deployed, each trap is partly filled with brine that is so dense, it won’t mix with the surrounding seawater as the traps are lowered down into the depths.
As the traps drift in the dark waters, tiny particles of “marine snow” (bits of decomposing organisms, copepod poop, and other organic debris) settle into the tubes and are trapped in the brine. Marine snow is the main food source for many deep-sea organisms. Because so many organisms (especially microbes) consume marine snow, you see less and less of the stuff as you go deeper and deeper in the ocean.
I had sort of planned to shoot some photos of the sediment-trap recovery, but I’m afraid I didn’t quite make it. I woke up to the screech of the back-deck winch, then got out of my bunk and looked out my window, which overlooks the stern of the ship. But then I went back to bed. It was partly laziness, and partly a hazy memory that someone on the team had said they would grab a few shots for me.
In any case, the recovery of the sediment traps went pretty quickly. It only took the deck crew about 45 minutes to bring on board the 12 cross-shaped arrays, which were strung along a mooring line at 12 different depths from 100 to 500 meters below the surface.
Some of the deck crew may have had a break after the traps were recovered, but there was no rest for the UH team. At least half of the 144 sediment traps had to be processed as quickly as possible, without being exposed to bright light. These traps contained live microbes, which are going to be used in various chemical analyses, incubation experiments and gene analyses. When I finally made it down to the lab around 7 AM, the team had just finished breakfast and was setting up a “bucket brigade” to process these “live” samples.
I took a series of photographs showing a few of the steps involved in this process. For each of the “live” sediment traps, the researchers did the following:
- Sucked out the seawater from the top of the tube, leaving the salty brine inside
- Carefully stirred the brine inside the tube (without creating any air bubbles), until the particles were evenly distributed within the brine.
- Siphoned out samples of brine for DNA analyses and other experiments and analyses that required unpreserved microbes.
- Added preservative to the remaining brine, so that it could be analyzed for various chemicals on shore.
- Analyzed both the filtered particles and the brine for chemicals whose concentrations might change over time, including ammonium, nitrite, and other nutrients.
- Stored the remaining samples and subsamples in incubators, vials, tubes, and freezers for later analysis.
The samples of particles and fluid within the tubes will be used for many different analyses, from measuring the amount of nutrients (ammonium, nitrite, nitrate) in the fluid to determining the types of microbes that are living on the particles. One of the main reasons for the experiment is to create a detailed vertical profile showing how concentrations of particulate organic material change from 100 to 200 meters below the surface. This is why the researchers deployed so many sediment traps—there were traps at 100, 110, 120, 130, 140, 150, 160, 175, 200, 250, 300, and 500 meters to provide plenty of data points to create vertical profile.
Most sinking particles are created in the sunlit surface waters, by photosynthetic algae and microbes (“primary producers”). As this material sinks down into deeper water, it is consumed by all kinds of organisms, especially microbes. Thus, the amount of sinking organic material decreases as you go deeper in the ocean.
Since the late 1980s, oceanographers have used a specific mathematical formula to describe how rapidly this decrease takes place. This formula can be plotted as a vertical profile similar to the profile that will be created using the data from our sediment traps.
Between 100 and 200 meters, however, the process of nitrification can introduce additional nutrients into the seawater. This could possibly induce additional primary production, which in turn could generate additional sinking particles. Among the many goals of this experiment is to figure out if there is an increase in the amount of sinking particles near the depth at which nitrification is most intense (about 130 meters, during our cruise).
Visually this could mean that comparing the profile from our sediment traps with the profile generated by the standard formula. If there is a “bump” in the profile from our sediment traps, it could indicate that the oceanographers need to revise their formula for calculating the total amount of organic material that sinks into deep water.
Knowing the amount of organic material sinking into deep water is important for at least two reasons. First, this sinking material is the primary food source for many deep-sea organisms. Photosynthetic organisms cannot live more than a couple of hundred meters below the surface. Thus, organic material that sinks from the sunlit surface waters forms the basis for most deep-sea food webs. If we ever hope to understand deep-sea, we need to know more about the food supply to this largely unexplored habitat.
The second reason that scientists study sinking organic material is because this material contains a lot of carbon. When organic material sinks down into the deep water, it essentially removes carbon from the upper ocean, which in turn removes carbon from the atmosphere. As humans add more and more carbon (in the form of carbon dioxide) to the atmosphere, understanding this oceanic “scrubbing” process becomes more and more important to understanding the fate of our planet. I guess that’s a pretty good reason to give up a little sleep on a Friday night.
[ Top of Page ]

